Fig. 12
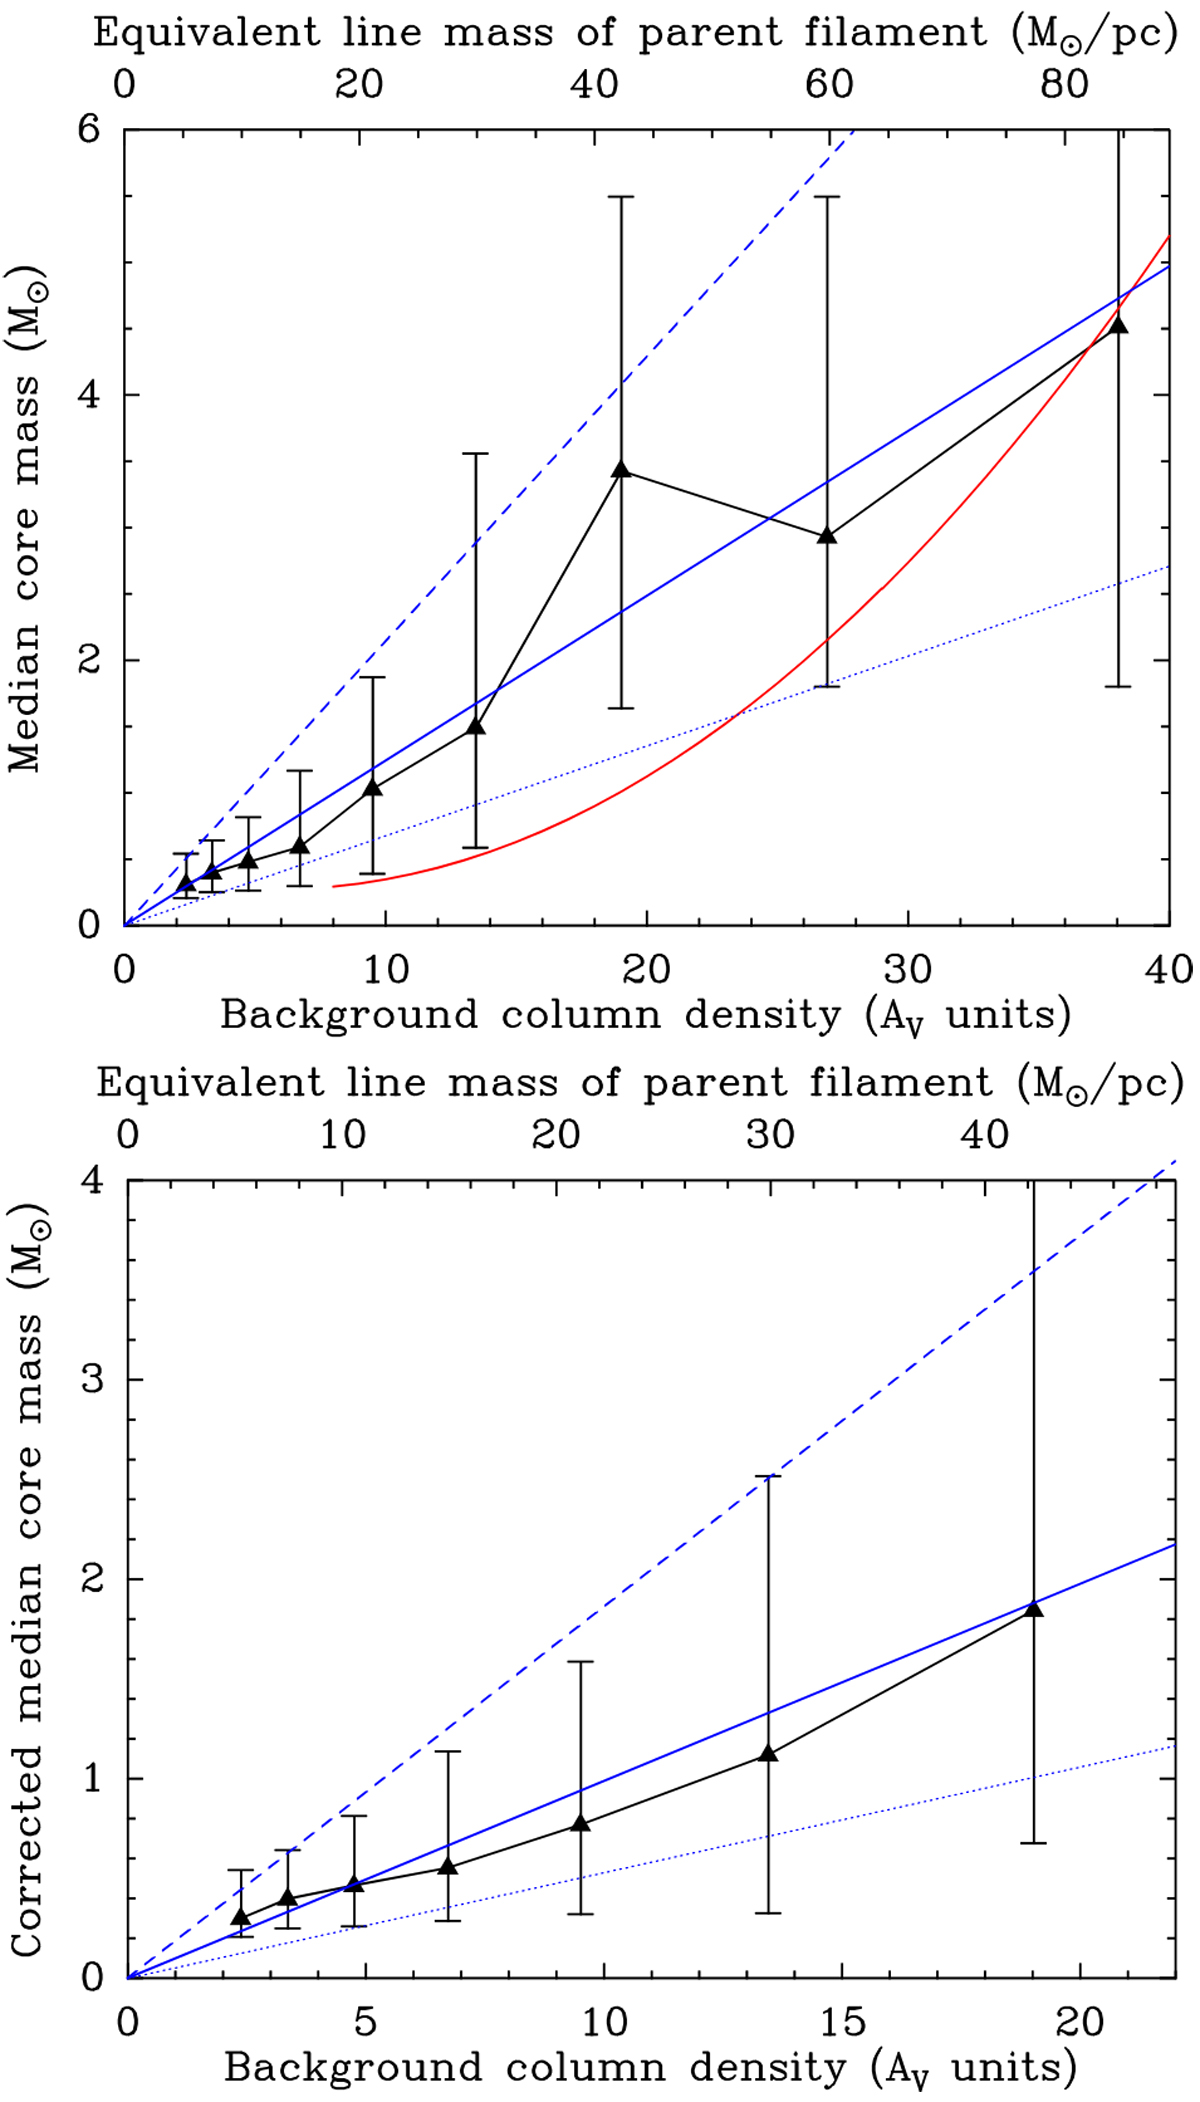
Top: median prestellar core mass versus background column density (black triangles). The error bars correspond to the inter-quartile range in observed masses for each bin of background column density. The solid, dashed and dotted blue lines are linear fits to the observed median, upper-quartile, and lower-quartile masses as function of background column density, respectively. The red curve shows how the mass at the 50% completeness level varies with background column density according to the model completeness curves of Appendix C (see Fig. C.4). The upper x-axis provides an approximate mass-per-unit-length scale, assuming the local backgroundaround each core is dominated by the contribution of a parent filament with a characteristic width Wfil = 0.1 pc (see end of Sect. 4.5). Bottom: same as upper panel after correcting the distribution of observed core masses for incompleteness effects before estimating the median core mass and inter-quartile range in each column density bin (see Sect. 4.2). Both the median prestellar core mass and the dispersion in core masses increase roughly linearly with background column density.
Current usage metrics show cumulative count of Article Views (full-text article views including HTML views, PDF and ePub downloads, according to the available data) and Abstracts Views on Vision4Press platform.
Data correspond to usage on the plateform after 2015. The current usage metrics is available 48-96 hours after online publication and is updated daily on week days.
Initial download of the metrics may take a while.