Fig. 10
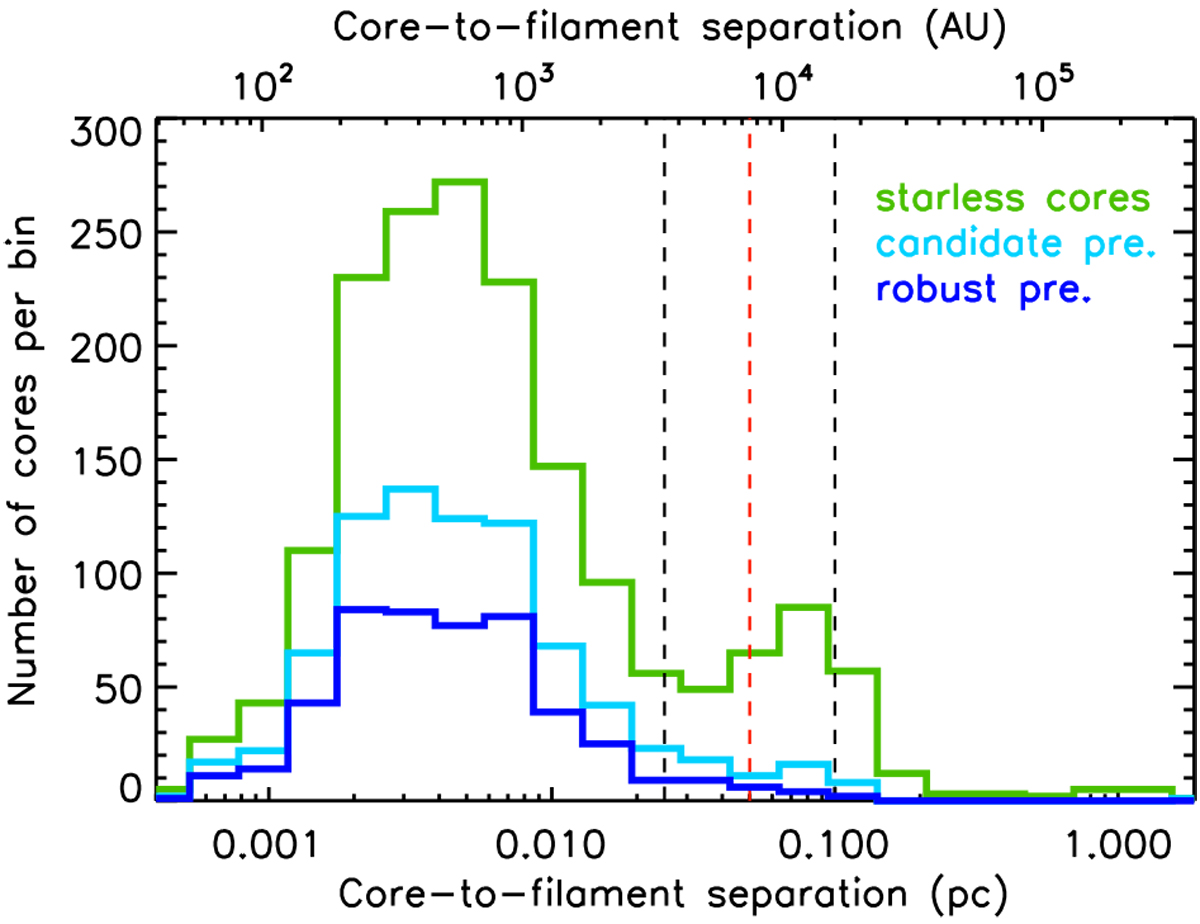
Distribution of separations between dense cores and the nearest filament crests in the DisPerSE raw sample of filaments. The green histogram is for all 1768 starless cores, the light blue histogram for the 804 candidate prestellar cores, and the dark blue histogram for the 490 robust prestellar cores. The vertical lines mark the half widths (i.e., on either side of the filament crests) of a 0.1 pc-wide (red), 0.5 × 0.1 pc-wide (inner black), and a 2 × 0.1 pc-wide (outer black) filament.
Current usage metrics show cumulative count of Article Views (full-text article views including HTML views, PDF and ePub downloads, according to the available data) and Abstracts Views on Vision4Press platform.
Data correspond to usage on the plateform after 2015. The current usage metrics is available 48-96 hours after online publication and is updated daily on week days.
Initial download of the metrics may take a while.