Fig. 1
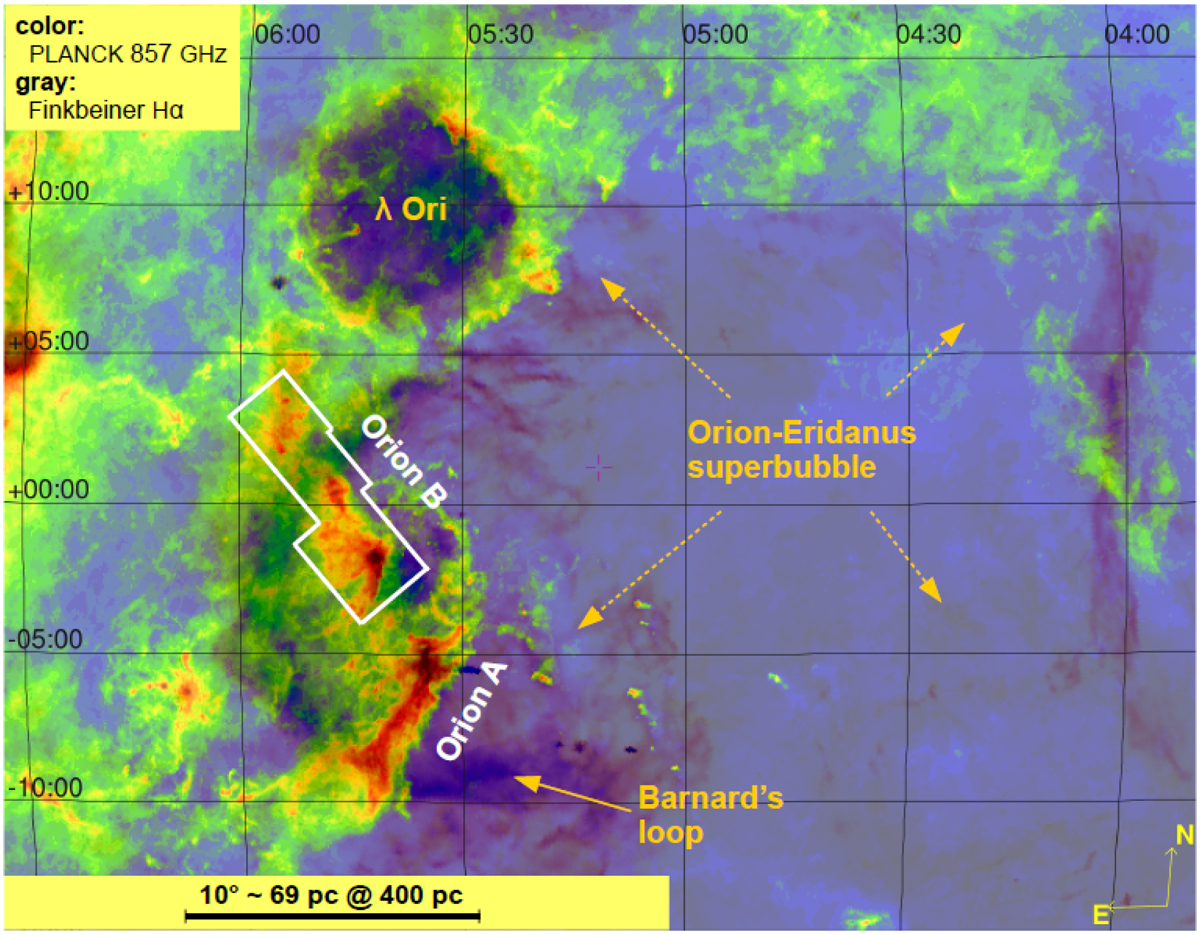
Large-scale view of the Orion-Eridanus superbubble (which reaches beyond Barnard’s Loop) and star-forming clouds along its wall. The color background shows Planck 857 GHz (350 μm) emission (Public Data Release 2, PR2), and the overplotted gray features represent Hα emission (Finkbeiner 2003). The region analyzed in this paper is outlined in white. (PR2 is described in the Planck 2015 Release Explanatory Supplement which is available at https://wiki.cosmos.esa.int/planckpla2015/).
Current usage metrics show cumulative count of Article Views (full-text article views including HTML views, PDF and ePub downloads, according to the available data) and Abstracts Views on Vision4Press platform.
Data correspond to usage on the plateform after 2015. The current usage metrics is available 48-96 hours after online publication and is updated daily on week days.
Initial download of the metrics may take a while.