Fig. 9
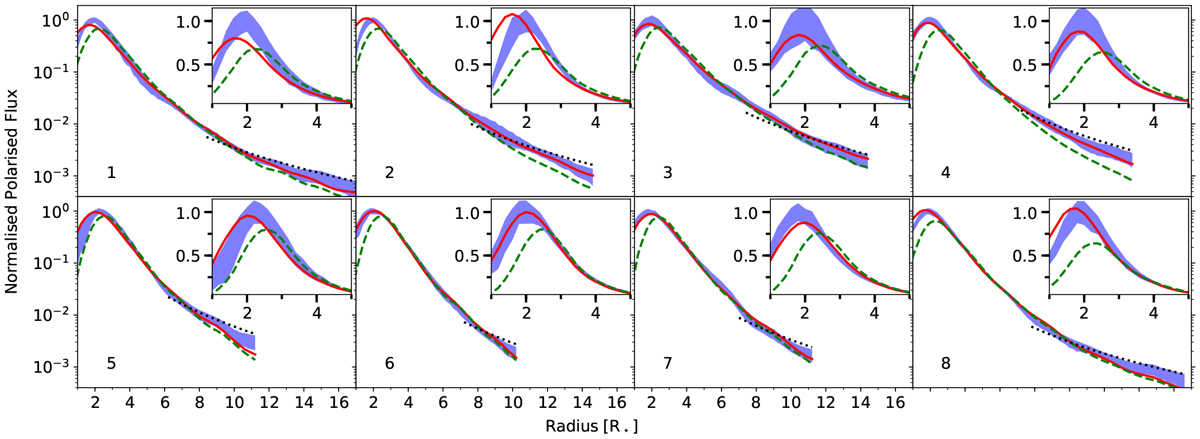
Models to fit the polarised light observed towards W Hya for each of the eight octants of the image in filter cnt820. The observations with the 1σ error bars are shown by the shaded blue region, the full red lines show the best-fit models for each octant, the dashed green line shows the best model with a 3.45 au star, and the dotted black lines show the best-fit models with a radial power-law index n = 2. The stellar radius assumed in this plot, R*, is the near-infrared stellar radius measured by Woodruff et al. (2009) of 18 mas.
Current usage metrics show cumulative count of Article Views (full-text article views including HTML views, PDF and ePub downloads, according to the available data) and Abstracts Views on Vision4Press platform.
Data correspond to usage on the plateform after 2015. The current usage metrics is available 48-96 hours after online publication and is updated daily on week days.
Initial download of the metrics may take a while.