Fig. 2
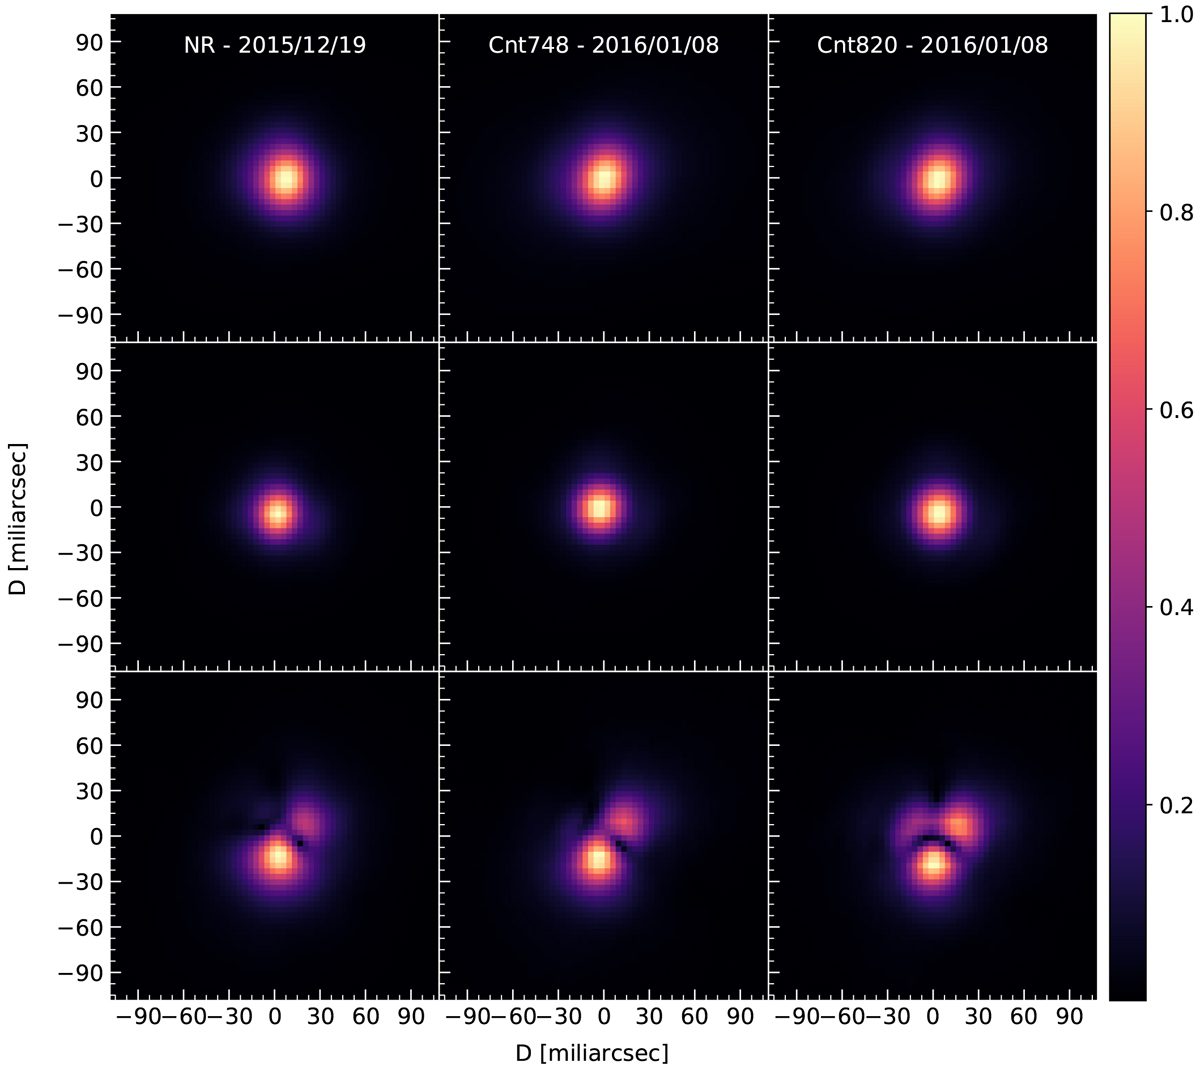
ZIMPOL observations of R Crt in filters NR, cnt748, and cnt820. Top panels: total intensity observed towards R Crt normalised to the peak intensity. Middle panels: images of the PSF-reference star HD 96364 normalised to the peak intensity. Bottom panels: polarised intensity observed towards R Crt normalised to the peak polarised intensity. The dark stripes seen in the centre appear in the regions where the total intensity peaks and do not correspond to physical features.
Current usage metrics show cumulative count of Article Views (full-text article views including HTML views, PDF and ePub downloads, according to the available data) and Abstracts Views on Vision4Press platform.
Data correspond to usage on the plateform after 2015. The current usage metrics is available 48-96 hours after online publication and is updated daily on week days.
Initial download of the metrics may take a while.