Free Access
Fig. 8
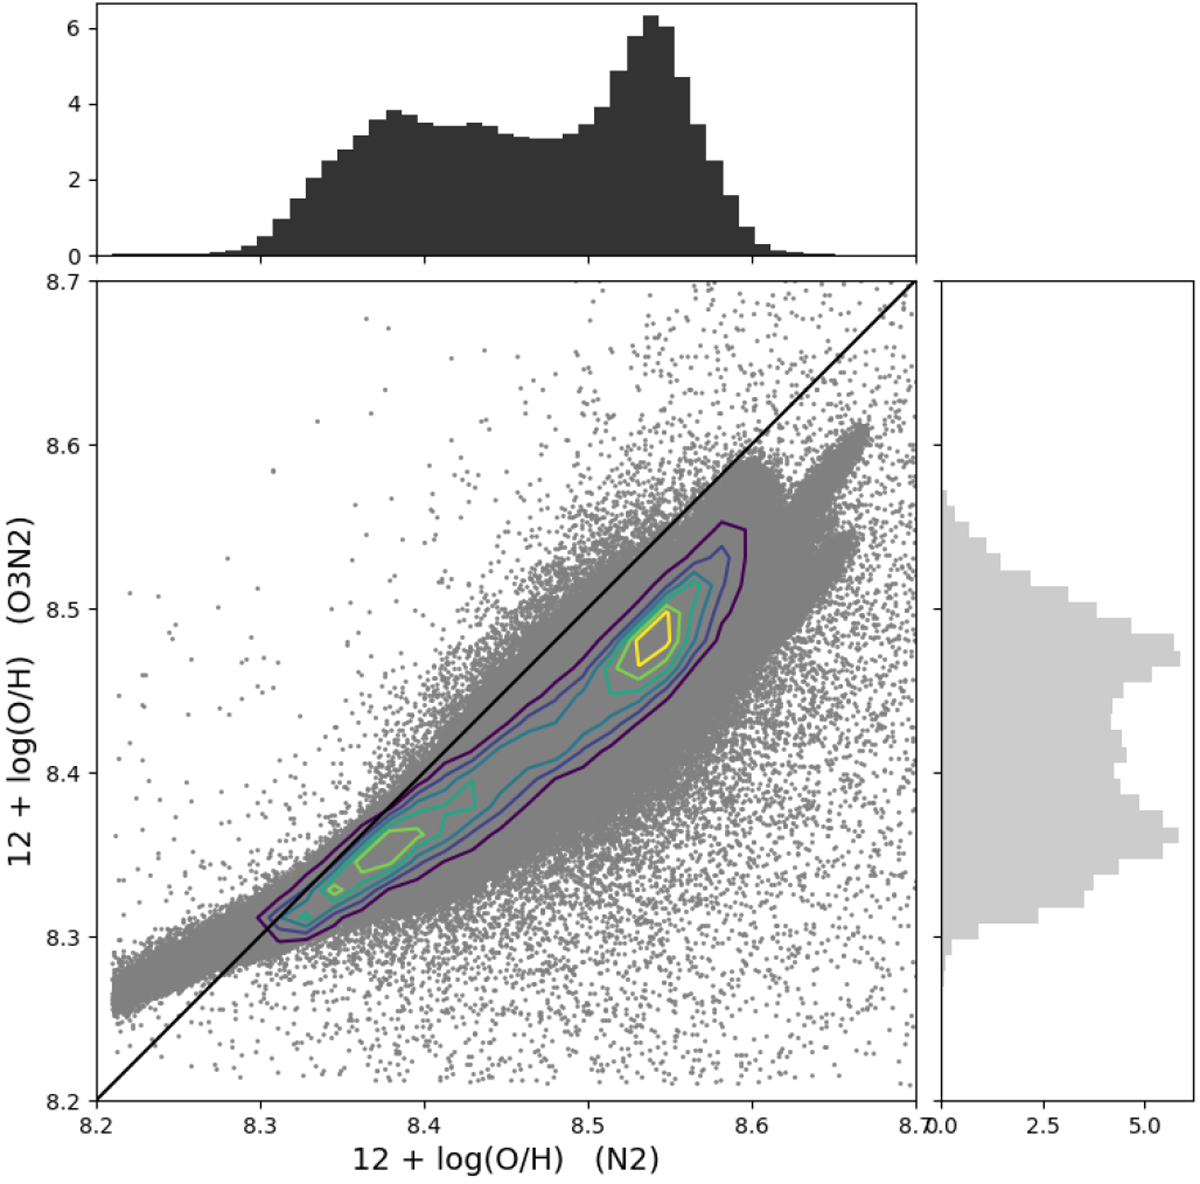
Oxygen abundances derived from the two line ratios, N2 and O3N2. The contours trace the highest concentration of data points, with levels at 20 × 103, 40 × 103, 60 × 103, 80 × 103, 100 × 103, and 120 × 103. The histograms are normalized to peak, and in black is shown the one-to-one line.
Current usage metrics show cumulative count of Article Views (full-text article views including HTML views, PDF and ePub downloads, according to the available data) and Abstracts Views on Vision4Press platform.
Data correspond to usage on the plateform after 2015. The current usage metrics is available 48-96 hours after online publication and is updated daily on week days.
Initial download of the metrics may take a while.