Free Access
Fig. 7
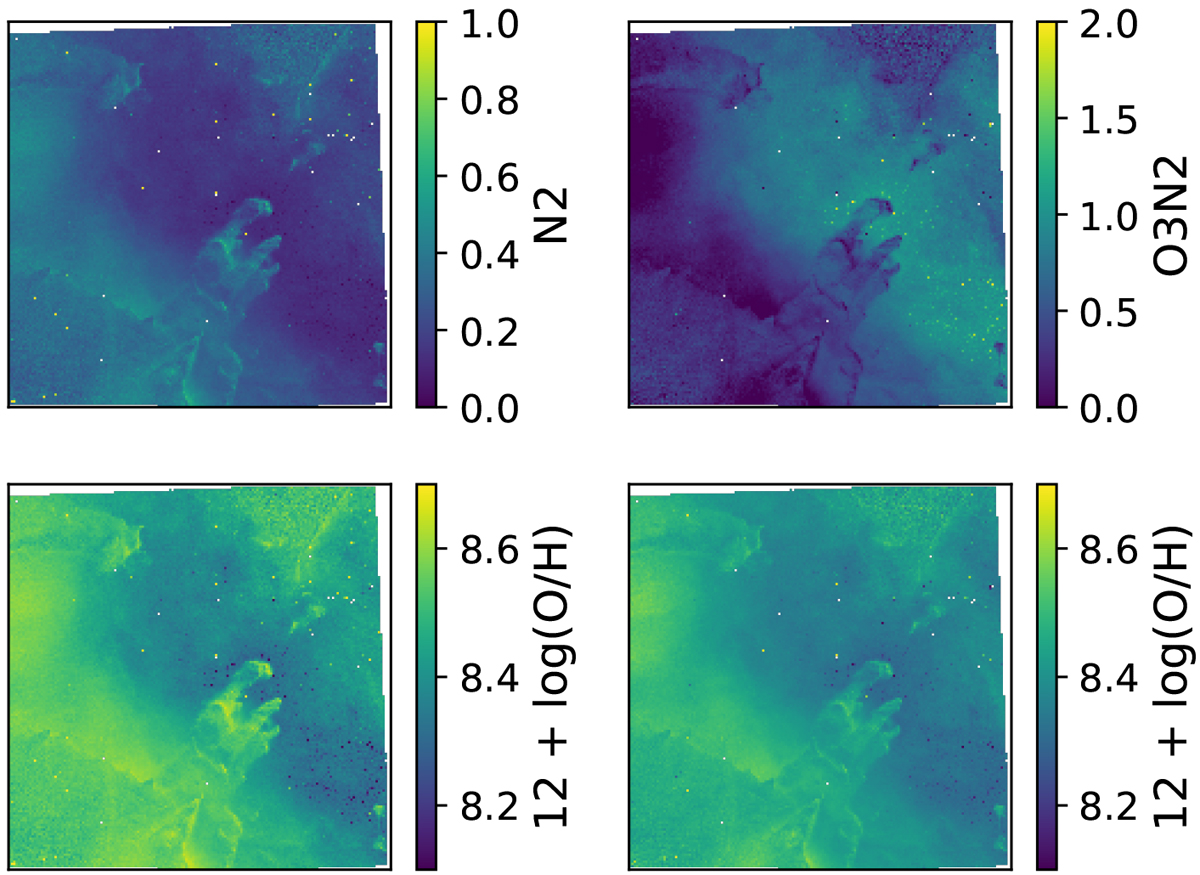
Line ratio maps (upper left is N2 and upper right is O3N2), as well as the derived oxygen abundance from the two (lower left and lower right, respectively). The lower panels are scaled to the same limits to illustrate the different values obtained from the two tracers.
Current usage metrics show cumulative count of Article Views (full-text article views including HTML views, PDF and ePub downloads, according to the available data) and Abstracts Views on Vision4Press platform.
Data correspond to usage on the plateform after 2015. The current usage metrics is available 48-96 hours after online publication and is updated daily on week days.
Initial download of the metrics may take a while.