Fig. 6
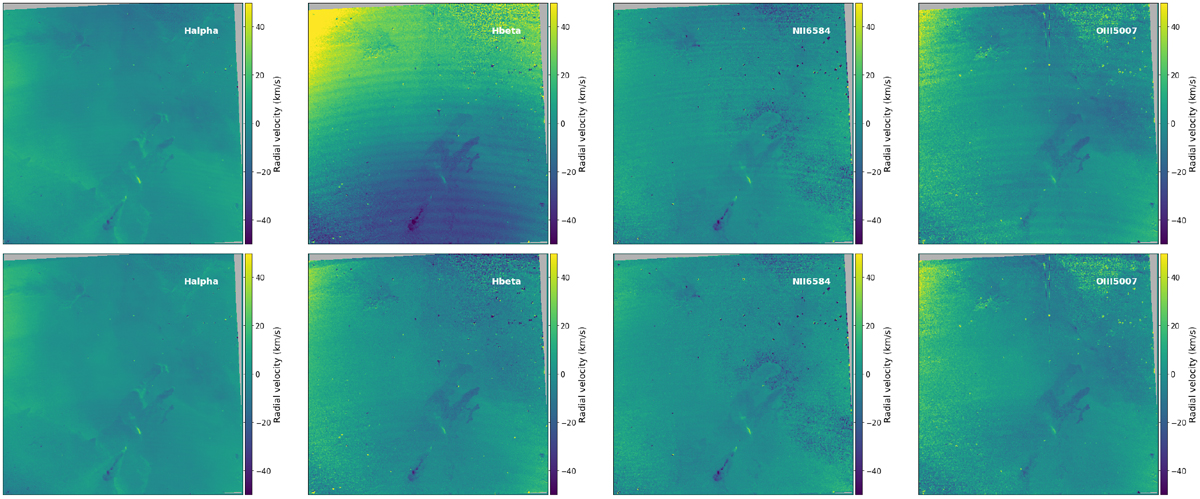
Emission line radial velocity maps for some of the emission lines that clearly show velocity structure. From left to right: Hα, Hβ, [N II]λ6584, and [O III]λ5007. Top row: before correction but after subtraction of the median value. Bottom row: after correction (see text for details). All maps are smoothed with a 2-pixel wide Gaussian and the scale ranges from −50 km s−1 to +50 km s−1.
Current usage metrics show cumulative count of Article Views (full-text article views including HTML views, PDF and ePub downloads, according to the available data) and Abstracts Views on Vision4Press platform.
Data correspond to usage on the plateform after 2015. The current usage metrics is available 48-96 hours after online publication and is updated daily on week days.
Initial download of the metrics may take a while.