Fig. 13
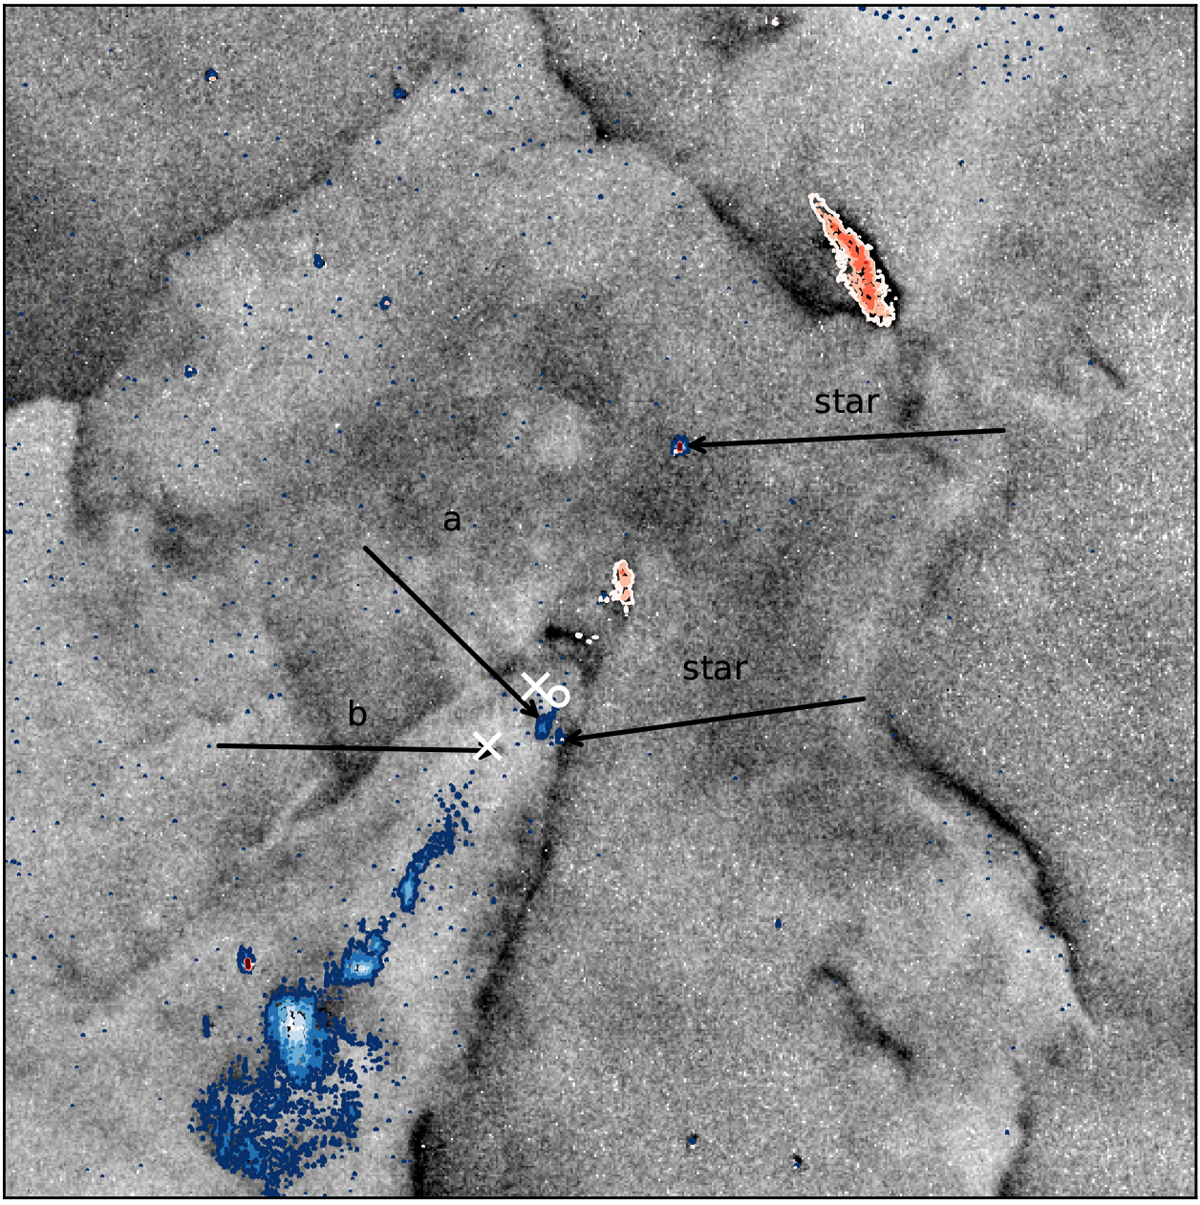
[S II]λ6717 integrated line map with contours from the Hα radial velocity map. Blue contours range from −50 to −15 km s−1 and red contours from 15 to 50 km s−1. The white crosses correspond to the positions of HH-N and HH-S (upper and lower cross, respectively), the white circle indicates the location of an infrared point source (see Fig. 14), while the black arrows indicate the locations of knots a and b, as well as of two stellar sources.
Current usage metrics show cumulative count of Article Views (full-text article views including HTML views, PDF and ePub downloads, according to the available data) and Abstracts Views on Vision4Press platform.
Data correspond to usage on the plateform after 2015. The current usage metrics is available 48-96 hours after online publication and is updated daily on week days.
Initial download of the metrics may take a while.