Fig. 11
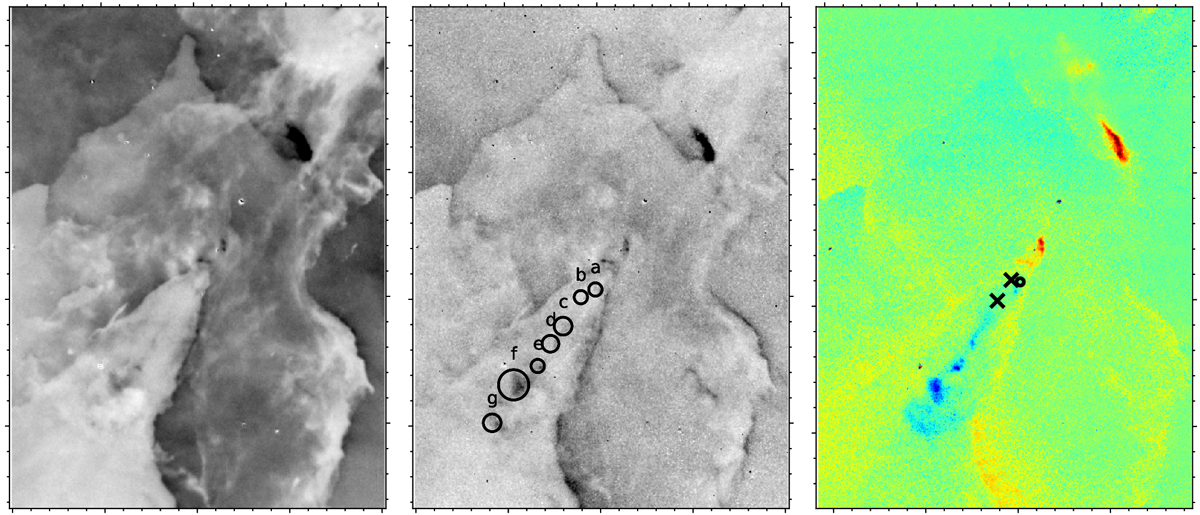
Left and middle panels: Hα and [S II]λ6717 flux maps, respectively, right panel: Hα radial velocity map. The radial velocity map shows radial velocities, relative to the mean value of the surrounding matter, and is scaled from −45 to 40 km s−1. The circles labelled a through g identify theseven blueshifted knots. The upper and lower crosses in the right panel indicate the position of HH-N and HH-S respectively, while the black circle indicates the position of a point source identified in the NIR data (see Fig. 14).
Current usage metrics show cumulative count of Article Views (full-text article views including HTML views, PDF and ePub downloads, according to the available data) and Abstracts Views on Vision4Press platform.
Data correspond to usage on the plateform after 2015. The current usage metrics is available 48-96 hours after online publication and is updated daily on week days.
Initial download of the metrics may take a while.