Fig. 2
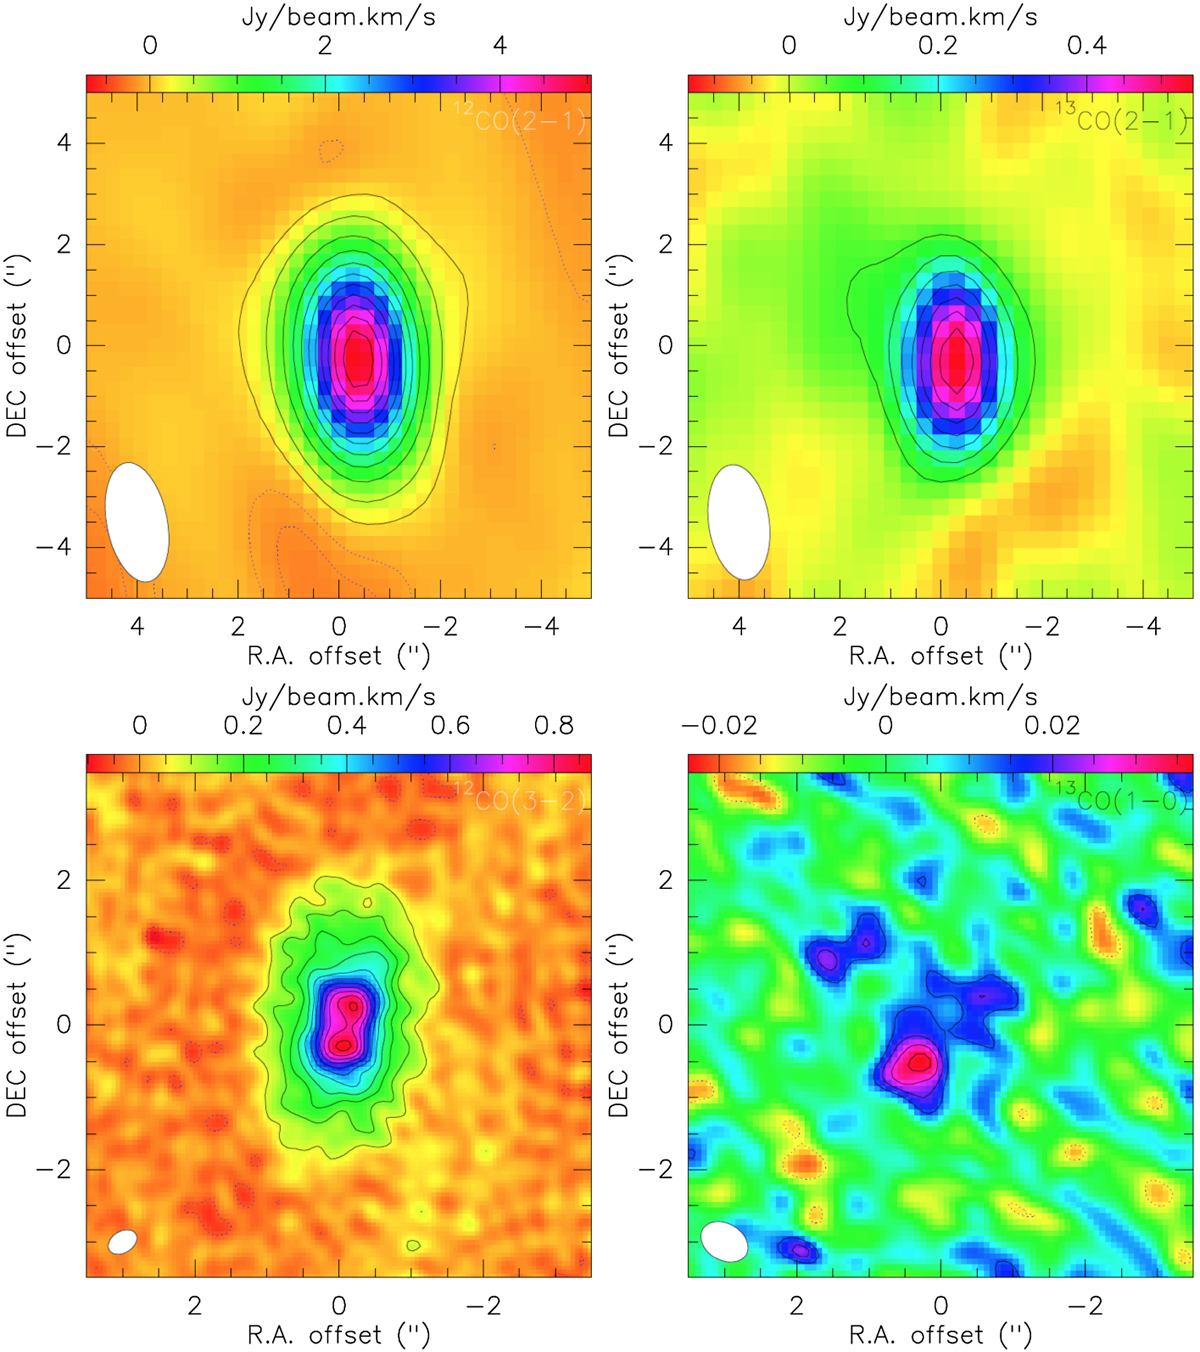
Maps of integrated CO emission for the four detected transitions (the continuum was not subtracteddue to its very low level of emission). Top: NOEMA observations, from left to right: 12CO J = 2 → 1 (first contour at 5σ, second contour at 15σ, then 15σ spacing withσ = 31 mJy beam−1 km s−1), and 13CO J = 2 → 1 with 3σ spacing contours, σ = 23 mJy beam−1 km s−1. Dotted lines show negative contours in steps of 3σ. Bottom:ALMA observations, from left to right: 12CO J = 3 → 2 with uniform weighting to highlight the central gas cavity (3σ spacing, σ = 40 mJy beam−1 km s−1), and 13CO J = 1 → 0 1σ spacing contours starting at 2σ (for positive and negative contours), σ = 6.8 mJy beam−1 km s−1.
Current usage metrics show cumulative count of Article Views (full-text article views including HTML views, PDF and ePub downloads, according to the available data) and Abstracts Views on Vision4Press platform.
Data correspond to usage on the plateform after 2015. The current usage metrics is available 48-96 hours after online publication and is updated daily on week days.
Initial download of the metrics may take a while.