Fig. 1
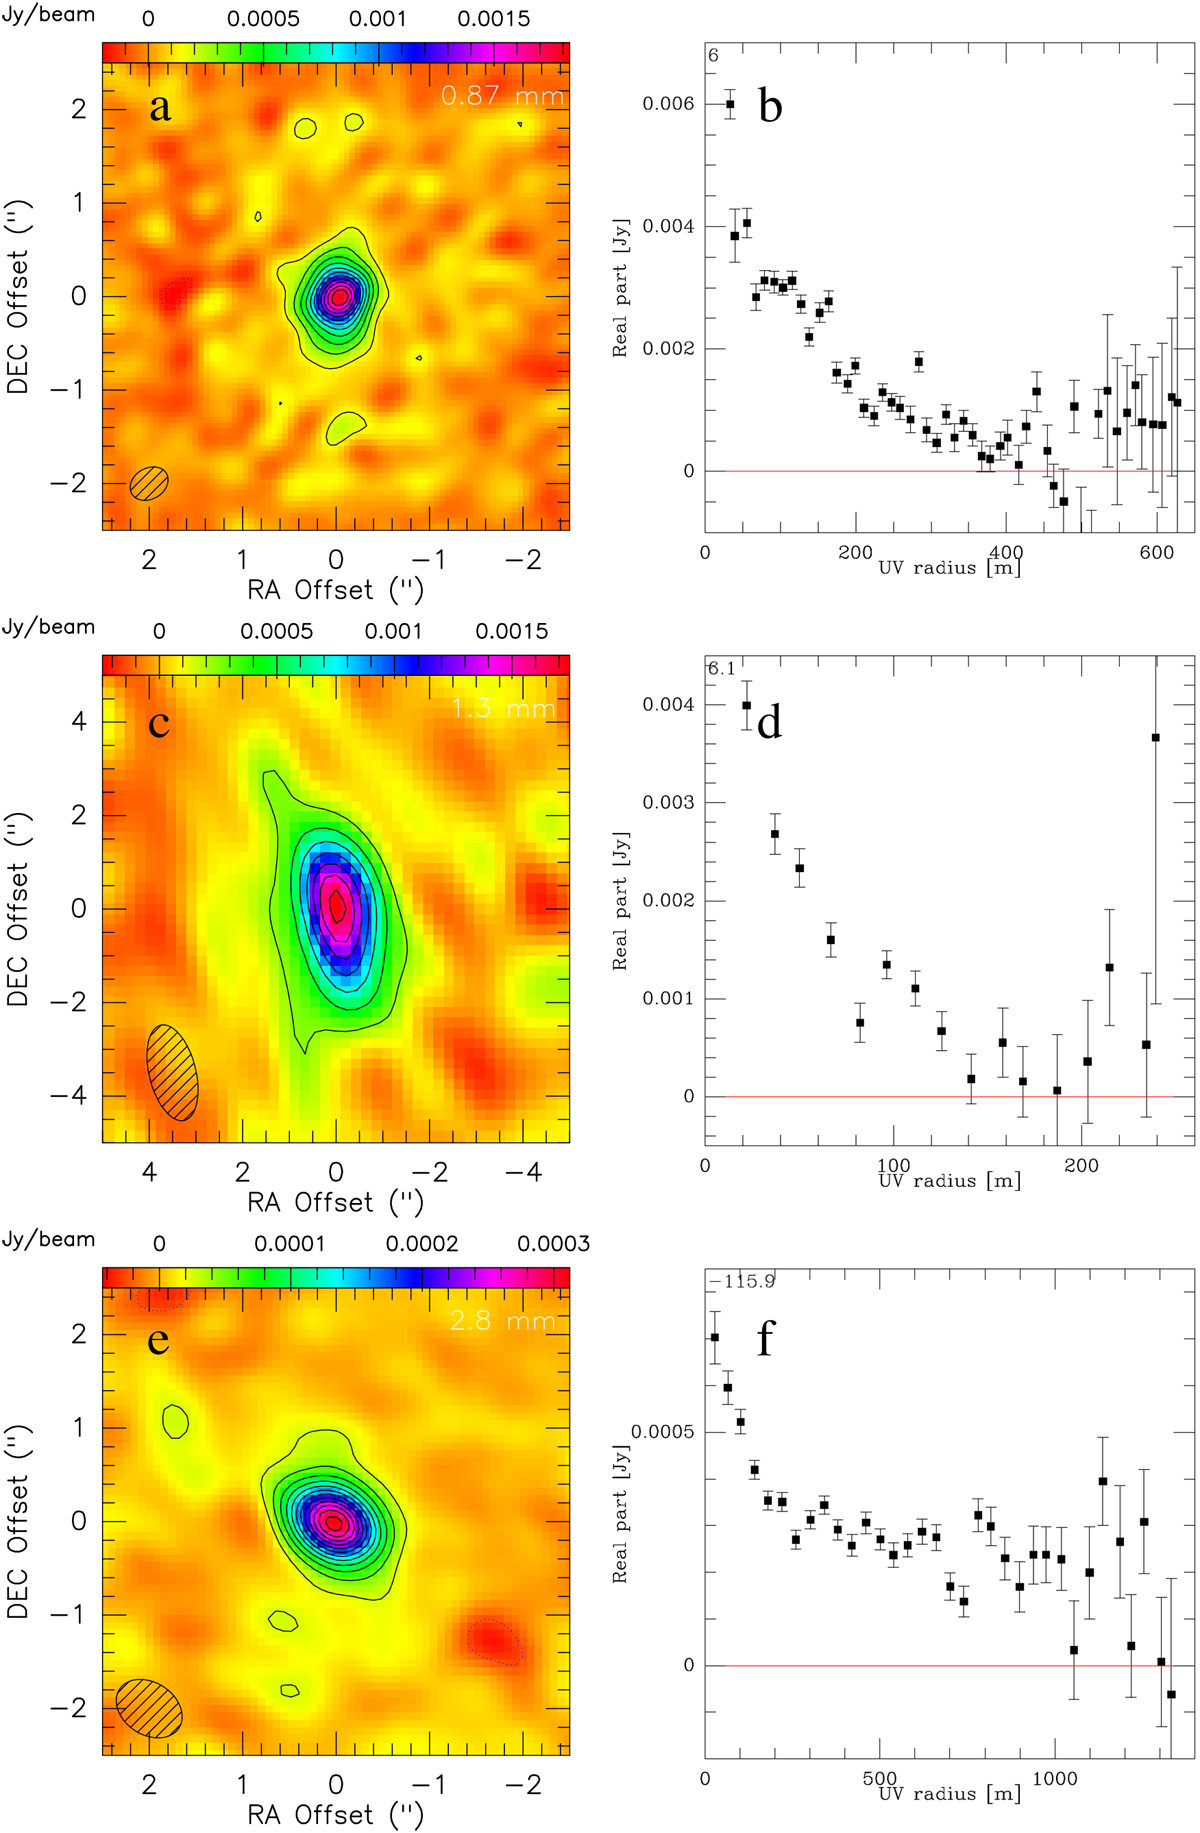
Left column: continuum emission maps, all contours are set with 3σ spacing, panel a: ALMA data at 0.87 mm, σ = 0.051 mJy beam−1, contours; (c) NOEMA data at 1.3 mm, σ = 0.078 mJy beam−1; (e) ALMA data at 2.8 mm, σ = 0.008 mJy beam−1. We note that the scale of panel c is changed to include the more extended emission. Right column: real part of the visibility (with spatial binning) as a function of the u, v radius in the Fourier plane, panels b, d, and f: correspond to data in panels a, c, and e, respectively.
Current usage metrics show cumulative count of Article Views (full-text article views including HTML views, PDF and ePub downloads, according to the available data) and Abstracts Views on Vision4Press platform.
Data correspond to usage on the plateform after 2015. The current usage metrics is available 48-96 hours after online publication and is updated daily on week days.
Initial download of the metrics may take a while.