Fig. 1.
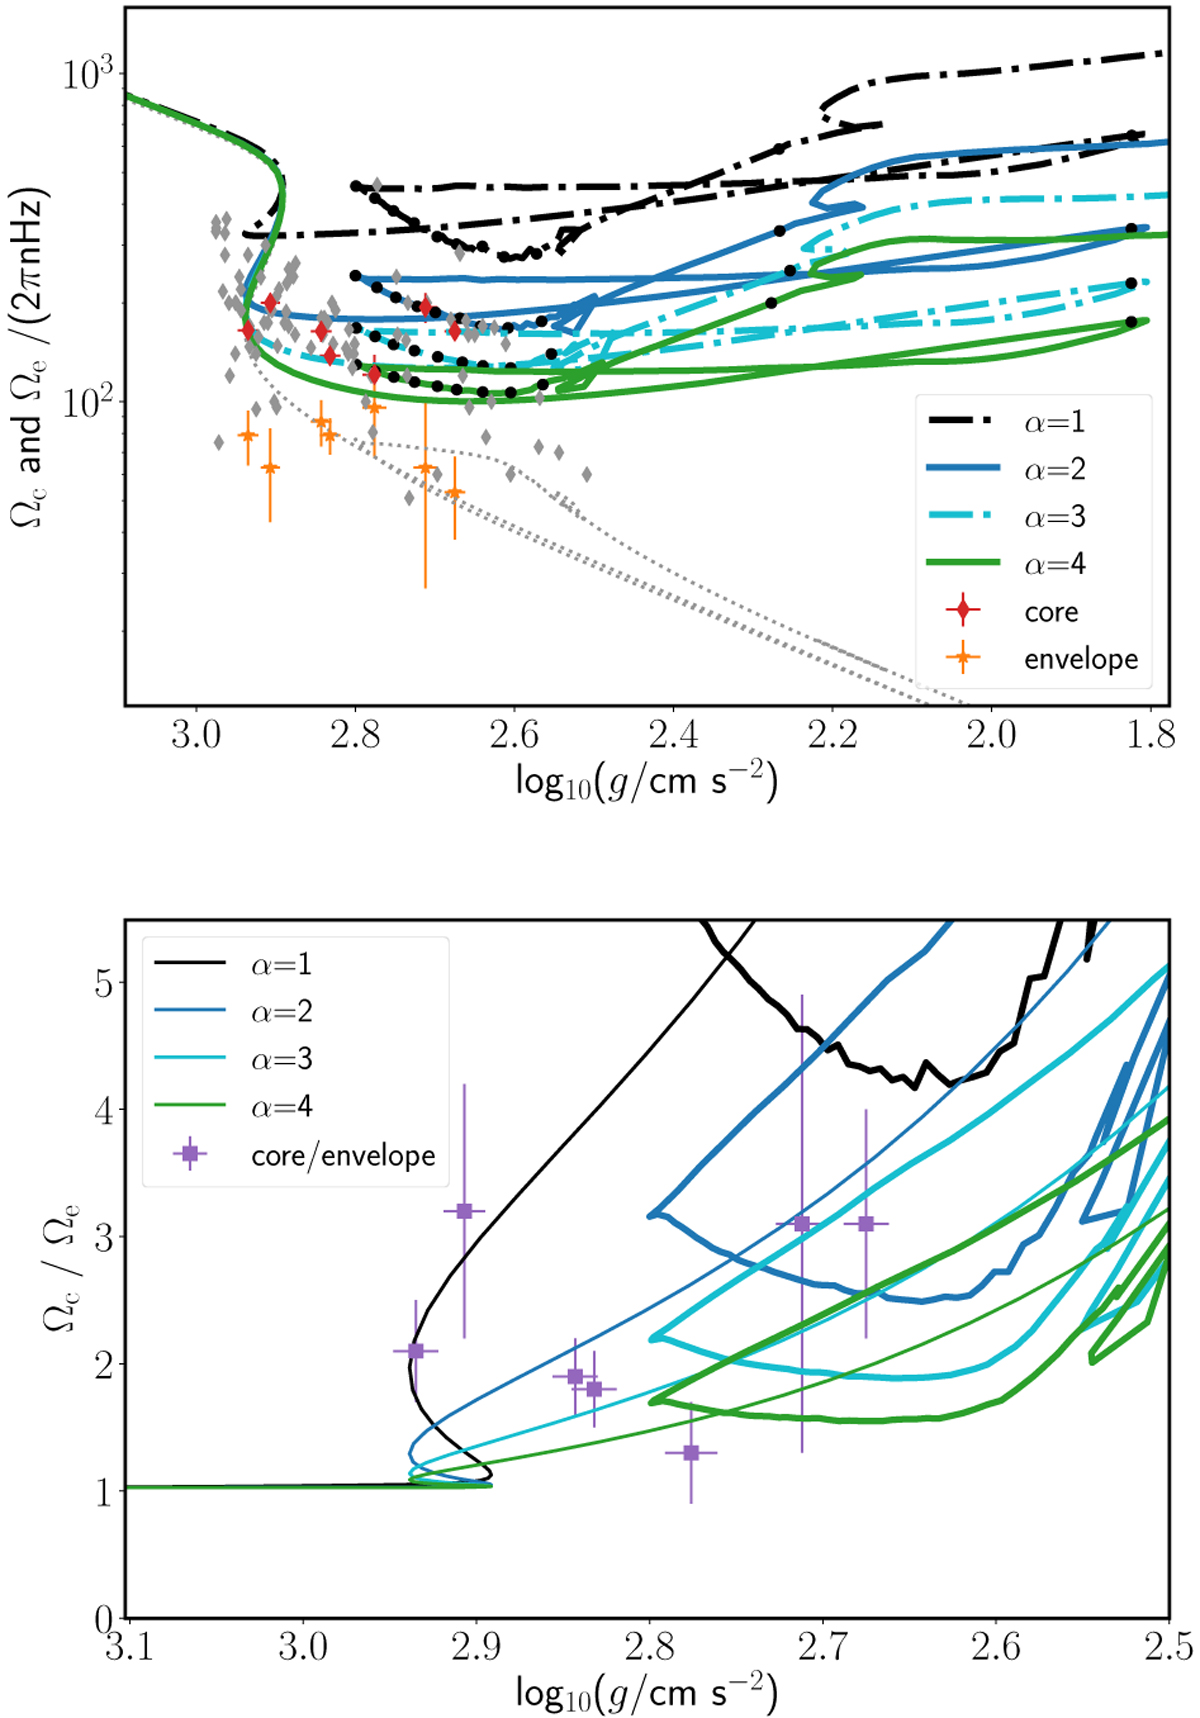
Comparison of models with different alphas to all observed core rotation rates (top panel) within 2–3 M⊙ range. Highlighted in colour are the core He burning stars of Deheuvels et al. (2015), showing the core (red diamonds) and surface (orange stars) values in the top panel and the ratio of the two values (purple squares) in the bottom panel. The core rotation rates of Mosser et al. (2012) and Tayar et al. (2019) are shown in grey. Values of α > 1 are needed to reach the observed range of core rotation rates and degree of differential rotation. One surface rotation rate is plotted (dotted line) in the left panel. The surface rotation rates of the other models are identical to the one plotted and, therefore, they are not included in this figure.
Current usage metrics show cumulative count of Article Views (full-text article views including HTML views, PDF and ePub downloads, according to the available data) and Abstracts Views on Vision4Press platform.
Data correspond to usage on the plateform after 2015. The current usage metrics is available 48-96 hours after online publication and is updated daily on week days.
Initial download of the metrics may take a while.