Fig. A.1.
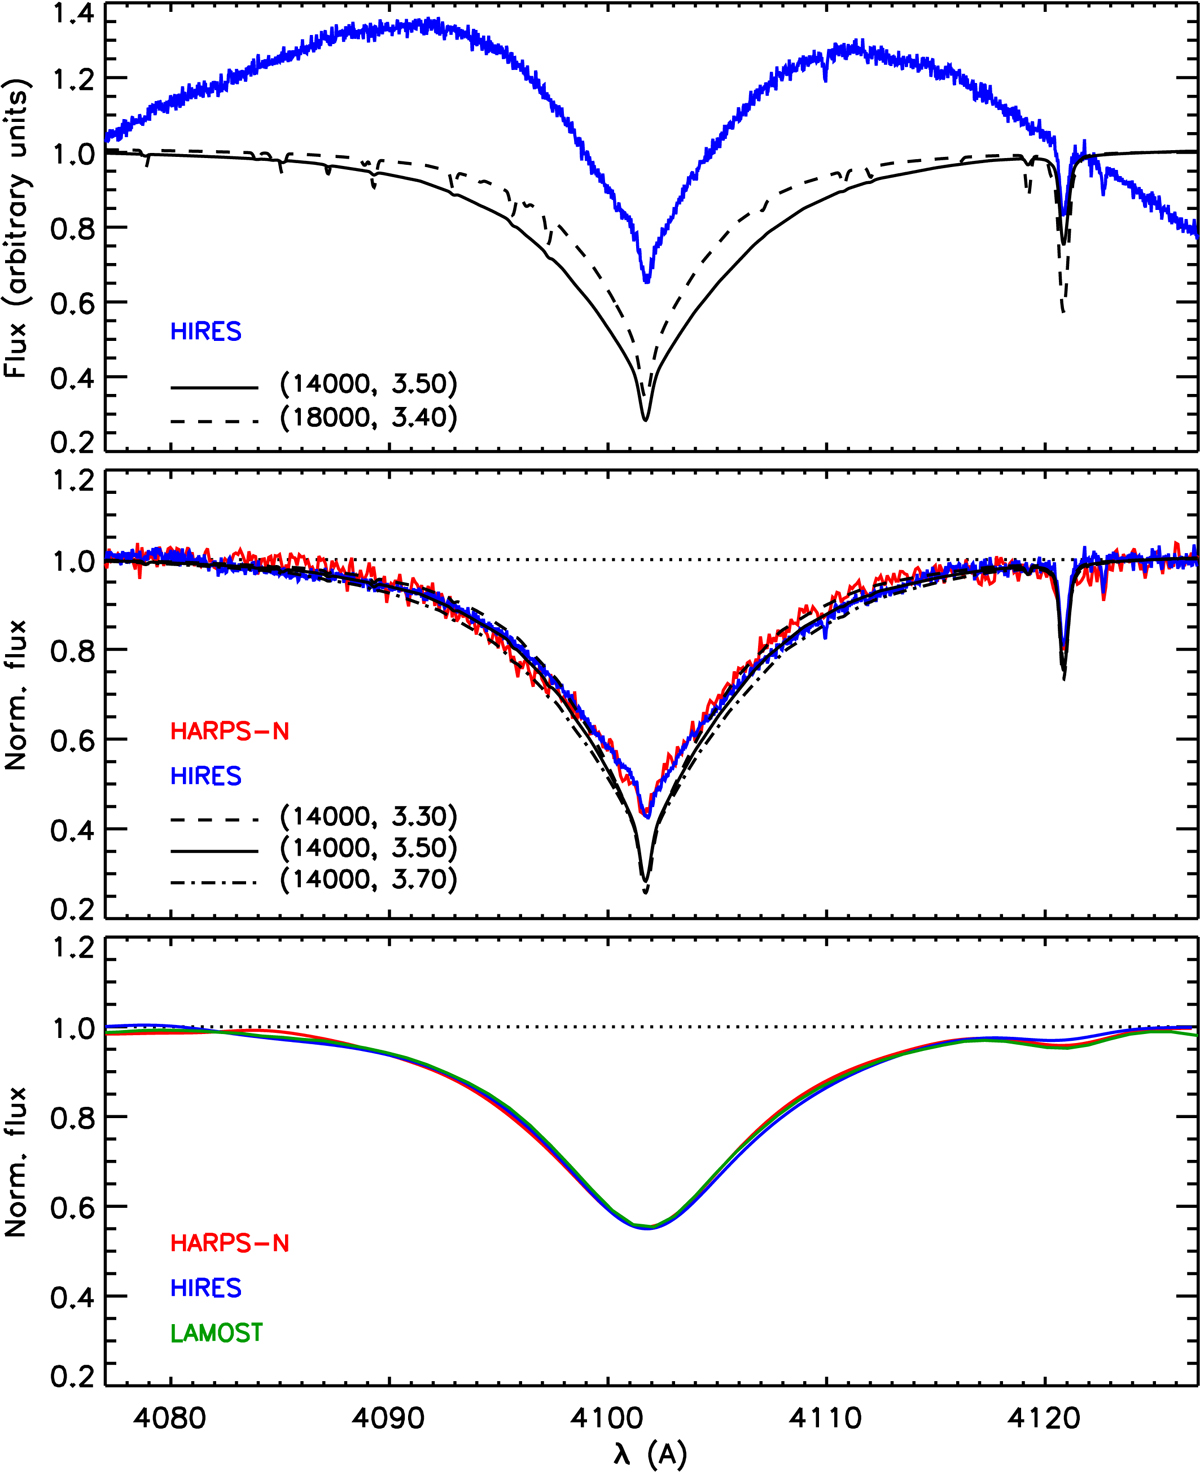
Top panel: the blue line is the scaled extracted echelle order from Keck/HIRES, the black continuous and dashed lines are the FASTWIND profiles for the indicated parameters. Middle panel: blue and red lines are the line profiles normalized using the procedure discussed in the text of Appendix A, while the black lines illustrate the effect of a change of ±0.2 dex in log g at constant Teff. Bottom panel: here we compare the smoothed, normalized profiles for TNG/HARPS-N, Keck/HIRES and LAMOST, illustrating the good consistency obtained for all three datasets.
Current usage metrics show cumulative count of Article Views (full-text article views including HTML views, PDF and ePub downloads, according to the available data) and Abstracts Views on Vision4Press platform.
Data correspond to usage on the plateform after 2015. The current usage metrics is available 48-96 hours after online publication and is updated daily on week days.
Initial download of the metrics may take a while.