Fig. 3.
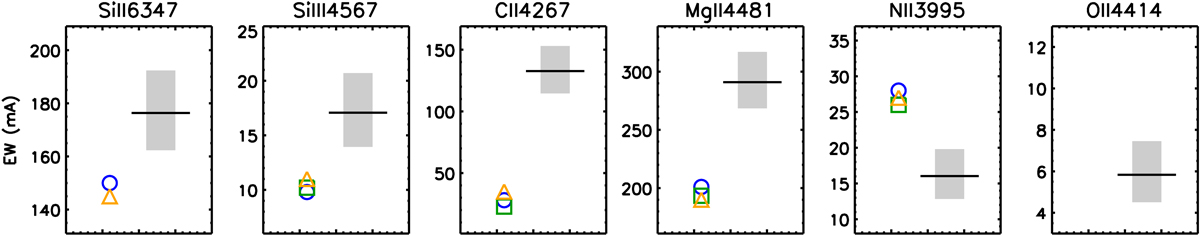
Open symbols: EW measurements for the indicated diagnostic lines using the various high-resolution spectra available (circles: HIRES; triangles: HARPS-N; squares: HORuS). Gray rectangles: predicted range of EWs from FASTWIND models with the same Teff and log g and a range in abundance ±0.15 dex around the reference value (solid horizontal line; see Table 1). Right panel, including the predicted EW of the O IIλ4414 Å has been included for reference to indicate that the non-detection of O II lines does not necessarily imply a low oxygen abundance.
Current usage metrics show cumulative count of Article Views (full-text article views including HTML views, PDF and ePub downloads, according to the available data) and Abstracts Views on Vision4Press platform.
Data correspond to usage on the plateform after 2015. The current usage metrics is available 48-96 hours after online publication and is updated daily on week days.
Initial download of the metrics may take a while.