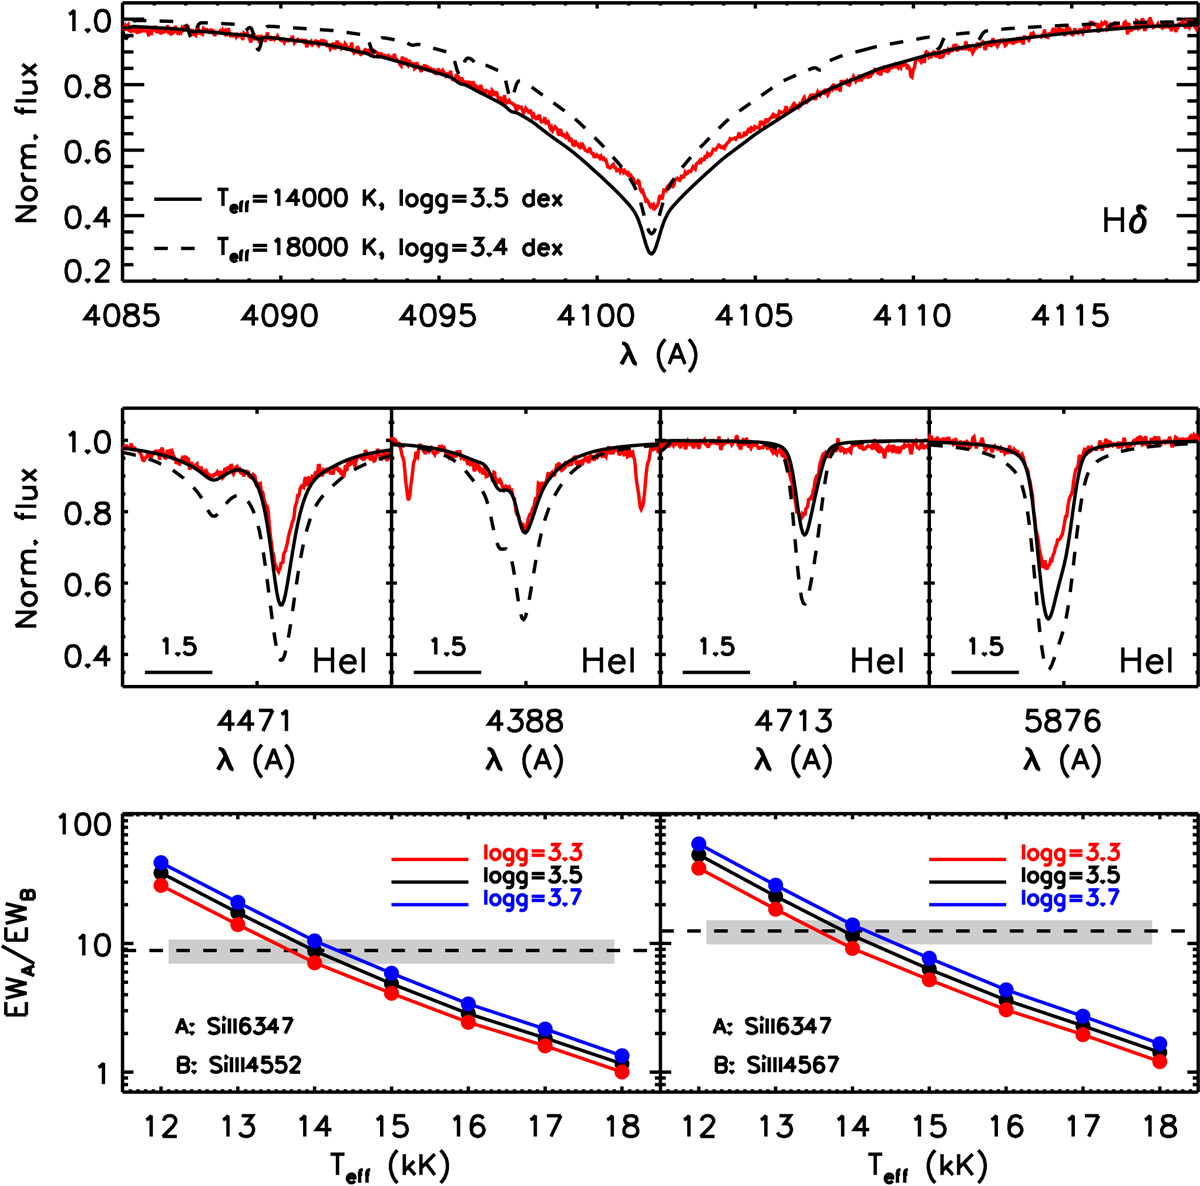
Fig. 1.

Summary of the quantitative spectroscopic analysis strategy used to determine Teff and log g. Top and middle panels: line profiles of Hδ and some He I lines in the HIRES spectrum, respectively. Shown are the synthetic spectra associated with two FASTWIND models with a different (Teff, log g) pair: our best solution (14 000 K, 3.5 dex, solid) and the one proposed by Liu et al. (2019; 18 000 K, 3.4 dex, dashed). The Hδ lines and some He I lines show infilling from the disk emission. Bottom panels: predicted variation of the ratios Si IIλ6347/Si IIIλ4552 (left) and Si IIλ6347/Si IIIλ4567 (right) with Teff for three values of log g (Si abundance fixed to solar). The horizontal gray band indicates the empirical measurement and its associated uncertainty.
Current usage metrics show cumulative count of Article Views (full-text article views including HTML views, PDF and ePub downloads, according to the available data) and Abstracts Views on Vision4Press platform.
Data correspond to usage on the plateform after 2015. The current usage metrics is available 48-96 hours after online publication and is updated daily on week days.
Initial download of the metrics may take a while.


