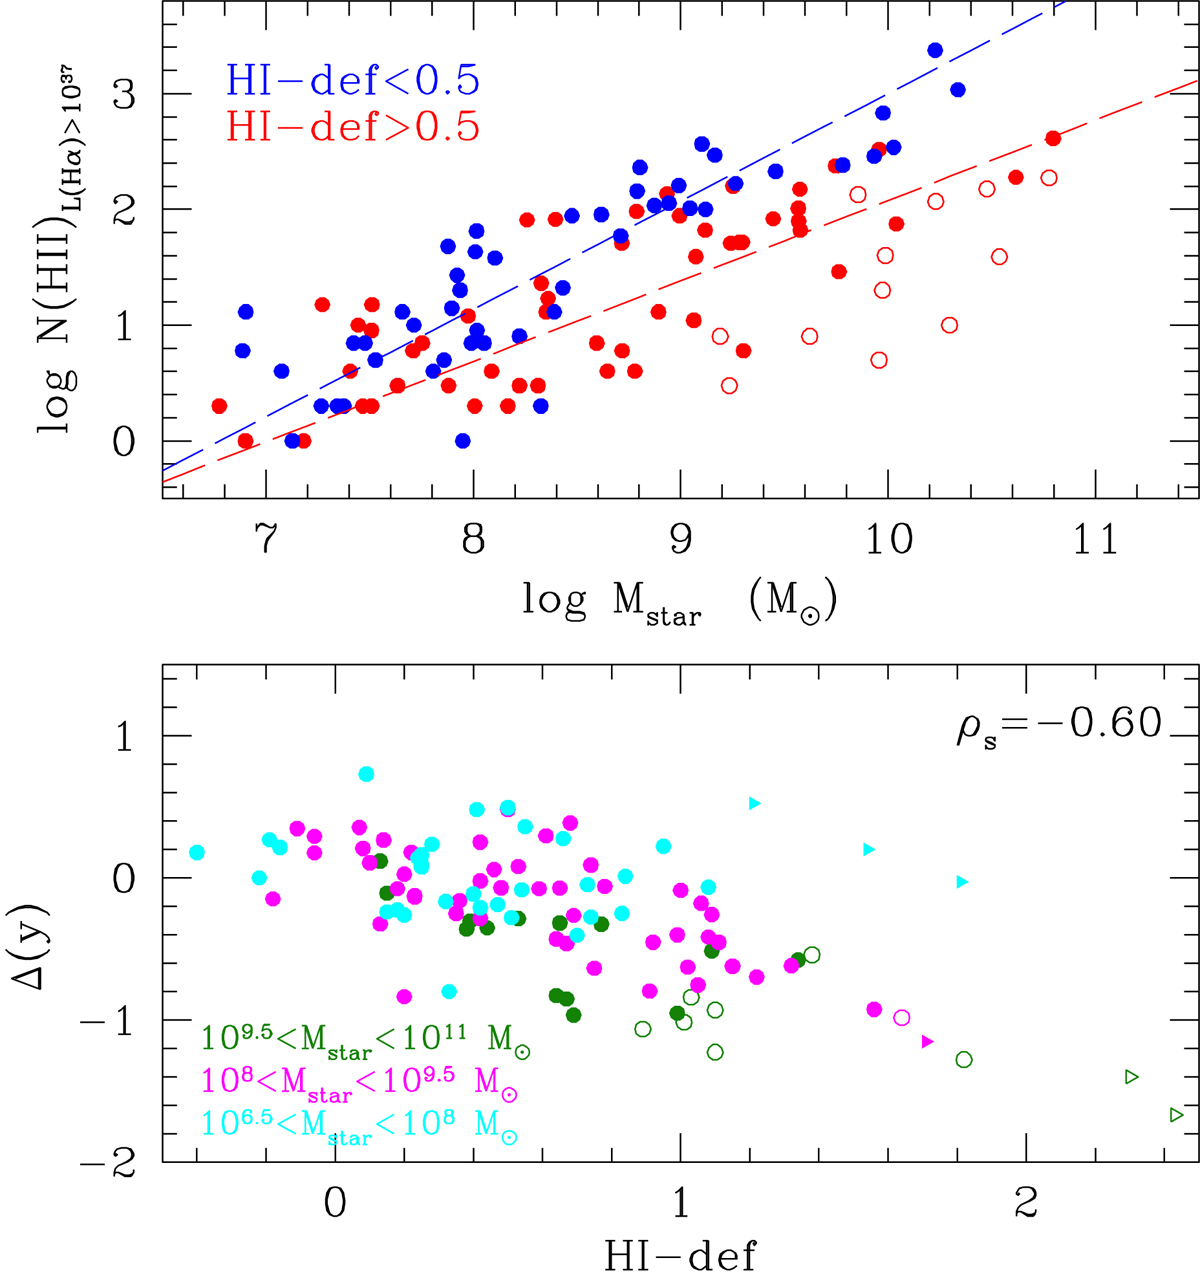
Fig. 1.

Upper panel: relationship between the number of HII regions of luminosity L(Hα) > 1037 erg s−1 and the stellar mass of galaxies. Blue symbols indicate gas-rich systems (HI-def ≤ 0.5), red symbols HI-stripped galaxies (HI-def > 0.5). Empty symbols represent bulge-dominated Sa-Sab galaxies. The dashed blue and red lines give the bisector fits for gas-normal and gas-stripped systems. Lower panel: relationship between the residual of the above relation derived for HI-rich galaxies and the HI-deficiency parameter. Symbols are colour-coded in ranges of stellar mass: Mstar > 109.5 M⊙ – dark green, 108 < Mstar ≤ 109.5 M⊙ – magenta, 106.5 < Mstar ≤ 108 M⊙ – cyan. Dots are for HI-detected galaxies, triangles for HI-undetected objects (lower limits in the HI-deficiency parameter). ρs is the Spearman correlation coefficient.
Current usage metrics show cumulative count of Article Views (full-text article views including HTML views, PDF and ePub downloads, according to the available data) and Abstracts Views on Vision4Press platform.
Data correspond to usage on the plateform after 2015. The current usage metrics is available 48-96 hours after online publication and is updated daily on week days.
Initial download of the metrics may take a while.


