| Issue |
A&A
Volume 634, February 2020
|
|
|---|---|---|
| Article Number | L2 | |
| Number of page(s) | 6 | |
| Section | Letters to the Editor | |
| DOI | https://doi.org/10.1051/0004-6361/201937293 | |
| Published online | 30 January 2020 | |
Letter to the Editor
Evidence for ≳4 Gyr timescales of neutron star mergers from Galactic archaeology
1
Dipartimento di Fisica e Astronomia, Universitá degli Studi di Firenze, Via G. Sansone 1, 50019 Sesto Fiorentino, Italy
e-mail: This email address is being protected from spambots. You need JavaScript enabled to view it.
2
INAF/Osservatorio Astrofisico di Arcetri, Largo E. Fermi 5, 50125 Firenze, Italy
Received:
10
December
2019
Accepted:
23
December
2019
Abstract
The nucleosynthetic site of the rapid (r) neutron-capture process is currently being debated. The direct detection of the neutron star merger GW170817, through gravitational waves and electromagnetic radiation, has confirmed such events as important sources of the r-process elements. However, chemical evolution models are not able to reproduce the observed chemical abundances in the Milky Way when neutron star mergers are assumed to be the only r-process site and realistic time distributions of such events are taken into account. Now for the first time, we combine all the available observational evidence of the Milky Way and its dwarf galaxy satellites to show that the data can only be explained if there are (at least) two distinct r-process sites: a quick source with timescales comparable to core-collapse supernovae, tquick ≲ 108 yr, and a delayed source with characteristic timescales tdelayed ≳ 4 Gyr. The delayed r-process source most probably originates in neutron star mergers, as the timescale fits well with that estimated for GW170817. Given the short timescales of the quick source, it is likely associated with massive stars, though a specific fast-track channel for compact object mergers cannot be excluded at this point. Our approach demonstrates that only by looking at all the available data will we be able to solve the puzzle that is the r-process.
Key words: stars: abundances / Galaxy: abundances / Galaxy: evolution / galaxies: abundances / galaxies: dwarf / Local Group
© ESO 2020
1. Introduction
The Laser Interferometer Gravitational-Wave Observatory (LIGO) detection of the event GW170817 is one of the major milestones of modern astrophysics (Abbott et al. 2017a). Through observations of gravitational waves and electromagnetic radiation, GW170817 was shown to be the first unambiguous detection of a neutron star merger (NSM), and also proved them to be a source of short gamma-ray bursts (GRBs; Abbott et al. 2017b,c). The electromagnetic radiation following GW170817 has confirmed that NSMs are an important source of the rapid (r) neutron (n)-capture process (Chornock et al. 2017; Cowperthwaite et al. 2017; Drout et al. 2017; Pian et al. 2017; Tanaka et al. 2017; Villar et al. 2017; Watson et al. 2019). Furthermore, GW170817 is currently the only NSM to date with a confirmed detection of its host galaxy, which is an early-type galaxy with a predominantly old stellar population (Abbott et al. 2017a; Coulter et al. 2017). Different analyses have thus concluded long time delay of this event: > 3 Gyr by Pan et al. (2017); and 6.8−13.6 Gyr by Blanchard et al. (2017).
The long timescales which have been estimated for GW170817 and the fact that a large fraction of short GRBs are associated with early-type galaxies (Berger 2014; Fong et al. 2017) pose a problem for Galactic archaeology. The observed stellar abundances of r-process elements in the Milky Way have proven difficult to reproduce when NSMs are assumed as the dominant (or only) source, both at the high- and the low-metallicity end. To date, no star has been found without any traces of an r-process enrichment, even at [Fe/H] < −3 (e.g., François et al. 2007; Roederer et al. 2014a). Thus it is required that NSMs occur very early after the onset of star formation. At higher metallicity, [Fe/H] > −1, the abundances of the r-process element1 Eu have been proven impossible to reproduce with NSMs as the only r-process source when physically motivated time delay distributions are adopted (e.g., Shen et al. 2015; van de Voort et al. 2015; Komiya & Shigeyama 2016; Côté et al. 2019; Hotokezaka et al. 2018; Simonetti et al. 2019). On the other hand, if short timescales of NSMs are assumed (≲108 yr), the abundance trend of the Milky Way disks can be readily explained (e.g., Grisoni et al. 2020). However, given what is known of the NSM GW170817, and short GRBs in general (Berger 2014; Fong et al. 2017), such time-delay distributions of NSMs are highly implausible (see also the detailed discussions in Skúladóttir et al. 2019; Côté et al. 2019).
Attempts have been made to solve this discrepancy between the time-delay distributions of NSMs and Galactic archaeology by invoking specific mechanisms that influence the abundances, such as natal kicks (Tauris et al. 2017), metallicity dependence of NSM frequency (Simonetti et al. 2019), or details in the physics of the interstellar medium (ISM; Schönrich & Weinberg 2019). However, all of the proposed mechanisms have to be specifically tailored for the Milky Way abundances, and are thus unable to self-consistently explain the observed Eu abundances in several galaxies at once (Skúladóttir et al. 2019; Bonetti et al. 2019). This highlights the importance of including all the available data when proposing scenarios to reconcile studies of NSMs and that of Galactic archaeology.
2. Observational data
With the goal of better understanding the r-process and its nucleosynthetic site(s), we gathered the available chemical abundances of stars in the Milky Way and its three largest satellite dwarf spheroidal (dSph) galaxies: Sagittarius, Fornax, and Sculptor. The aim is to put these chemical abundances in context with the star formation histories (SFHs) of these galaxies.
2.1. Star formation histories
A schematic view of the SFHs of different galaxies is shown in the left panel of Fig. 1. To simplify the discussion and to avoid uncertainties in the details of these SFHs, we define three broad age regions for star formation and stellar ages: Old ≥ 10 Gyr; 10 Gyr < Intermediate < 4 Gyr; and Young ≤ 4 Gyr. These definitions will be used hereafter.
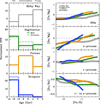 |
Fig. 1. Schematic figure of the SFHs (left) and abundance ratios (right) of the Milky Way solar neighborhood (gray), and the dSph galaxies: Sagittarius (green), Fornax (yellow), and Sculptor (blue). In the case of Sagittarius, SFHs of both the nucleus M 54 and two of its streams are shown. Two independent studies of the SFH of Sculptor are included. For references and more details see Sect. 2. |
As a proxy for the SFH of the solar neighborhood, we use the astroseismic age measurements of Silva Aguirre et al. (2018), which include ≈2000 stars out to distances of 2 kpc from the Sun. This work corrects for selection effects, and is consistent with the general consensus on the SFH of the solar neighborhood, i.e., a prominent peak in star formation 2−4 Gyr ago (Cignoni et al. 2006; Bernard 2018; Mor et al. 2019; Isern 2019).
A full SFH of the Sagittarius dSph galaxy is currently unavailable. A recent study by Alfaro-Cuello et al. (2019) provides ages of ≈6600 stars in the Sagittarius nuclear star cluster, M 54, which we use as a proxy of its SFH in Fig. 1 (dark green solid line). As in the original work, we only include stars whose ages have less than 40% uncertainty. Sagittarius is currently being disrupted, and multiple stellar streams in the Milky Way halo have been identified as originating from this dSph. The SFH of the Sagittarius streams within the Stripe 82 region were studied by de Boer et al. (2015), and are also shown in Fig. 1 for comparison, both for the bright stream (dotted-dashed green line), and the faint stream (dotted green line). For details see de Boer et al. (2015).
The SFH of Fornax is adopted from de Boer et al. (2012a). Two independent studies of the Sculptor SFH are shown in Fig. 1: the solid line shows that of de Boer et al. (2012b), and the dashed line is from Bettinelli et al. (2019).
2.2. Chemical abundances
Schematic chemical abundance trends in the Milky Way, Sagittarius, Fornax and Sculptor are shown in Fig. 1 (right panels). To avoid dealing with systematic errors between surveys as much as possible, we only included two surveys of Milky Way chemical abundances: Roederer et al. (2014b) at [Fe/H] ≲ −1, and Mishenina et al. (2013) at [Fe/H] ≳ −1.
The abundances of the Sagittarius dSph shown in Fig. 1 are only based on high-resolution (HR) UVES VLT or the Magellan MIKE spectra presented in Bonifacio et al. (2000), Sbordone et al. (2007), McWilliam et al. (2013), and Hansen et al. (2018). The Mg abundances for the Hansen et al. (2018) sample come from Skúladóttir et al. (in prep.). Sbordone et al. (2007) and McWilliam et al. (2013) identified their sample as M 54 member stars, while the metal-poor stars ([Fe/H] < −1) of Hansen et al. (2018) lie outside the virial radius of the nuclear cluster, but are still centrally located in Sagittarius.
Chemical abundances in Fornax come from Reichert et al. (2019). The abundance measurements for Mg, Ba and Eu in Sculptor are derived in Skúladóttir et al. (2019), who adopted the stellar parameters and [Fe/H] from Hill et al. (2019).
For all galaxies, outliers such as stars showing signatures of the s-process (i.e., high Ba abundances accompanied by high C abundances) are not included when deriving the main trends shown in Fig. 1 or the slopes shown in Table 1. These stars show the chemical enrichment of binary transfer (Lucatello et al. 2005; Starkenburg et al. 2014; Hansen et al. 2016) and are thus not indicative of the chemical evolution of the ISM. Apart from these outliers, the scatter in different abundance ratios is in most cases compatible with measurement errors. An exception is Fornax whose abundance ratios show a significant scatter, which is revealed in the large uncertainties on the slope in Table 1. In the case of [Ba/Mg] there is also an increase in scatter at [Fe/H] ≲ −2, and for [Eu/Mg] at [Fe/H] ≲ −2.5 (see also Skúladóttir et al. 2019). This does not affect our conclusions with regard to the r-process timescales.
Slopes of [Eu/Mg] with [Fe/H] in the Milky Way and its largest dSph satellite galaxies.
3. Constraining the r-process timescales
To investigate the timescales of the r-process it is useful to compare its main chemical products (e.g., Eu) to those of other known processes (see Fig. 2). The chemical abundance ratios of [Fe/Mg], [Ba/Mg], [Eu/Mg], and [Eu/Ba] are therefore shown in the right panels of Fig. 1 for the Milky Way and its three largest dSph galaxies, Sagittarius, Fornax, and Sculptor.
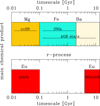 |
Fig. 2. Top panel: schematic timescales of the main nucleosynthetic sites: ccSN, SNIa and AGB stars, each labeled with a reference element. The timescales of ccSN and AGB stars are estimated from stellar lifetimes (Raiteri et al. 1996), while that of SNIa refers to the peak of the delay-time distribution function based on data and models (Maoz et al. 2014). Bottom panel: our inferred timescales of the quick and delayed r-process sources. |
The element Mg is almost exclusively made in core-collapse supernovae (ccSN; e.g., Nomoto et al. 2013) which have short timescales (see Fig. 2) and create ∼99% of the solar abundance (Tsujimoto et al. 1995). On the other hand, the majority of Fe and Ba in the Sun come from nucleosynthetic channels with significant time delay relative to ccSN. Around ∼57% of Fe in the solar neighborhood is estimated to come from supernovae type Ia (SNIa; e.g., Tsujimoto et al. 1995), which have characteristic timescales on the order of ∼1 Gyr (e.g., Maoz et al. 2014; see Fig. 2). Similarly, ∼85% of the Ba in the Sun comes from the slow (s) n-capture process (Bisterzo et al. 2014), which occurs in asymptotic giant branch (AGB) stars with m⋆ ≲ 8 M⊙ (e.g., Karakas & Lattanzio 2014). The delay times therefore depend on the lifetimes of the stars, which range from ∼108 yr for the most massive stars to the age of the Universe (and longer) for the lowest mass stars (see Fig. 2).
3.1. Delayed processes
Figure 1 shows how both [Fe/Mg] and [Ba/Mg] increase with metallicity in all depicted galaxies. This is a clear signature of processes that are delayed relative to ccSN, in this case SNIa and AGB stars, respectively. At the earliest stages in the evolution of any galaxy, its chemical enrichment is dominated by fast sources such as ccSN (see Fig. 2), which create large amounts of Mg and other α-elements, but also some Fe and other iron-peak elements (e.g., Nomoto et al. 2013). As time passes, the delayed processes (SNIa and AGB stars) start to contribute to the chemical enrichment, and thus the abundance ratios [Fe/Mg] and [Ba/Mg] start to increase. The increase in [Ba/Mg] in Fig. 1 starts at lower metallicity than that of [Fe/Mg]. This is in agreement with the findings of Amarsi et al. (2019), who concluded that the influences of AGB stars in the Milky Way disks become apparent earlier than than those of SNIa.
The increase in both [Fe/Mg] and [Ba/Mg] occurs at lower metallicity in the dwarf galaxies compared to the Milky Way (see Fig. 1). This is caused by less efficient chemical enrichment of the smaller galaxies, which are only able to enrich their ISM up to low metallicity (and thus low [Fe/H]) before the onset of the delayed processes, compared to the larger, more efficiently star forming Milky Way (e.g., Tolstoy et al. 2009; Hill et al. 2019).
Furthermore, higher values of [Fe/Mg] and [Ba/Mg] are reached in the dwarf galaxies than in the Milky Way (see Fig. 1). Contrary to the Milky Way, none of the dSph galaxies are currently forming stars. The largest dSphs, Sagittarius and Fornax, have not been forming stars for the last ∼1−2 Gyr (de Boer et al. 2012a; Alfaro-Cuello et al. 2019), while Sculptor has not formed stars for ∼6−10 Gyr (de Boer et al. 2012b; Bettinelli et al. 2019), see Fig. 1. As these dSph galaxies lost their gas and star formation ceased, the production of Mg from ccSN consequently decreased, while the amount of elements released by delayed processes (e.g., Fe and Ba) was set by a higher star formation rate (SFR) earlier on. These delayed products were then released into a small mass of gas, enhancing their influence (Hill et al. 2019).
Finally, we note that the SFHs and metallicity evolution with time are far more complex than implied by our schematic Fig. 1. In the dSph galaxies, metallicities are shown to have fairly clear correlations with age (de Boer et al. 2012b,a; Hill et al. 2019; Alfaro-Cuello et al. 2019). In the Milky Way, however, this correlation is not very strong (e.g., Salvadori et al. 2010; Silva Aguirre et al. 2018). Different components of the Milky Way have distinct SFHs where major merger events and stellar migration play a significant role (e.g., Helmi et al. 2018; Feuillet et al. 2019), but increasing [X/Mg] with age is also observed in solar twins for products of delayed processes, such as SNIa and AGB stars (e.g., Nissen & Gustafsson 2018). In general we can thus conclude that increasing [X/Mg] with [Fe/H] is a clear sign of a process that is delayed relative to ccSN. However, the quantitative evolution of [X/Mg] with [Fe/H] is highly dependent on the SFH of the galaxy and galaxy component in question.
3.2. Timescales of the r-process
From Fig. 1 it is clear that [Eu/Mg] does not behave in the same way as the known delayed processes, which are traced by [Fe/Mg] and [Ba/Mg]. The four galaxies do not give a consistent picture, where the Milky Way and Sculptor have a flat (or almost flat) trend of [Eu/Mg] with [Fe/H], while in the case of Fornax and Sagittarius there is a clear increase in [Eu/Mg] with metallicity (see also Table 1). As shown in McWilliam et al. (2013), this increase cannot be caused by the s-process (which produces a very small amount of Eu) since in both galaxies [Eu/Ba] > 0 (Fig. 1). Similarly, these high [Eu/Mg] values in Sagittarius and Fornax cannot come from the intermediate (i) n-capture process since it also predicts [Eu/Ba] < 0 (Hampel et al. 2016). Therefore, Sagittarius and Fornax are enhanced in the r-process, both with respect to ccSN ([Eu/Mg] > 0) and to the s-process ([Eu/Ba] > 0).
The observational data shown in Fig. 1 are therefore inconsistent with only one r-process source:
– One source with short timescales, ≲108 yr, cannot explain the increase in [Eu/Mg] with [Fe/H] in Fornax and Sagittarius.
– A single source with timescales similar to or longer than SNIa and AGB stars would result in much steeper [Eu/Mg] slopes in Sculptor and the Milky Way. Furthermore, such a source does not explain why r-process elements are found in stars at the lowest [Fe/H] < −3, which typically have no sign of either SNIa or AGB enrichment.
This discrepancy can only be resolved by adopting (at least) two r-process channels, one quick and one delayed source, see Fig. 2.
The quick source would have to be on timescales shorter than AGB stars, i.e., ≲108 yr. This quick source is consistent with having the same timescale as ccSN since the slopes of [Eu/Mg] in Sculptor and in the Milky Way disks ([Fe/H] < −1) are consistent with zero (see Table 1).
Quantifying the characteristic timescales of the delayed source is more challenging. However, it is immediately clear that the delayed r-process source has to have timescales that are longer than that of SNIa, otherwise a clear increase in [Eu/Mg] with [Fe/H] would appear in Sculptor and the Milky Way, similar to the increase in [Fe/Mg]. To explain the absence of a signature of the delayed source in Sculptor, it needs to have characteristic timescales that are longer than the Sculptor SFH. Figure 1 shows that SFH of Sculptor spans ∼4−6 Gyr, depending on the study (de Boer et al. 2012b; Bettinelli et al. 2019). We can therefore conclude that a delayed source with tdelayed ≳ 4 Gyr can explain both the abundance pattern observed in the two large dSph galaxies with extended SFHs, Sagittarius and Fornax, and in the smaller Sculptor, which has a truncated SFH (see Fig. 1).
When looking closely at the left panels of Fig. 1, it becomes clear why a delayed r-process source, with tdelayed ≳ 4 Gyr, would not significantly affect the chemical evolution of the solar neighborhood. The SFH of the solar neighborhood has a prominent peak around 2−3 Gyr ago (Silva Aguirre et al. 2018; Mor et al. 2019). This would enrich the ISM with large amounts of Mg from ccSN, and would thus similarly provide a large increase in products from the quick r-process source. The quick source would then completely dominate the production of Eu relative to the delayed source, whose influence is determined by a lower SFR earlier on. The time since this peak, 2−3 Gyr, is long enough for us to see the increase in Fe from SNIa and in Ba from AGB stars at [Fe/H] > −1 resulting from this peak of star formation. On the other hand, it is too short for the ISM to be enriched from the delayed r-process sites formed in this peak of SFH. Contrary to the solar neighborhood, more than 60% of the stars in Sagittarius (Alfaro-Cuello et al. 2019) and Fornax (de Boer et al. 2012a) formed more than 6 Gyr ago, and have SFHs extended enough to show the signatures of these old stars. Thus, the delayed source has much greater influence.
Our proposed scenario of (at least) two r-process sites is thus able to consistently explain the observational evidence from the Milky Way and its largest dSph galaxies. Figure 2 shows our inferred timescales of the two r-process sources, with distinct characteristic timescales, a quick source with tquick ≲ 108 yr, and a delayed source with tdelayed ≳ 4 Gyr.
4. Testing our scenario
To ensure that we have a self-consistent picture, it is important to see if other available data is in agreement with our proposed scenario of two distinct r-process sites with different characteristic timescales, namely a quick and a delayed source, see Fig. 2.
4.1. Solar twins
If there are two important r-process sites, we expect to see signatures of this in the high-quality data of solar twins. Stars with atmospheric parameters and [Fe/H] similar to those of the Sun, i.e., solar twins, allow chemical abundance measurements of unparalleled precision (Nissen & Gustafsson 2018).
Figure 3 shows [Eu/Mg] with age in solar twins with astroseismic age measurements, which are among the most accurate stellar ages achievable to date (e.g., García & Ballot 2019). There is a clear increase in [Eu/Mg] with age, indicative of a delayed component in the production of Eu. However, the slope of [Eu/Mg] with age (see also Table 2) flattens out around ∼4 Gyr ago, when the solar neighborhood was close to reaching its peak in SFR (Silva Aguirre et al. 2018). This is consistent with our previous discussion, and suggests that the quick source has been the dominant source of the r-process over the last 4 Gyr.
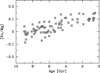 |
Fig. 3. Ratios of [Eu/Mg] in solar twins with different ages (Spina et al. 2018 (ages, Eu); Bedell et al. 2018 (Mg)). |
4.2. Smaller Milky Way dwarf galaxies
Small dSph galaxies around the Milky Way (i.e., smaller than Sculptor, M⋆ < 106M⊙) have a wide range of [Eu/Mg] distributions: they either increase or decrease with [Fe/H] and typically have a significant scatter (e.g., Shetrone et al. 2001, 2003; Sadakane et al. 2004; Cohen & Huang 2009, 2010; Norris et al. 2017). This stochasticity suggests that the rare and prolific events of the r-process are not well sampled in these small systems, which likely had a much lower SFR than larger systems (e.g., Salvadori et al. 2015). If only a handful of events occur in a galaxy with a SFH of several Gyr, chance plays a significant role in the distribution of [Eu/Mg] with [Fe/H] (see further discussion in Skúladóttir et al. 2019).
The ultra-faint dwarf (UFD) galaxies, M⋆ ≲ 105, typically have either very low [Eu/Mg] < 0 (e.g., Frebel et al. 2010, 2014; Roederer & Kirby 2014; Ji et al. 2019) or extremely high [Eu/Mg] > +0.5 (e.g., Ji et al. 2016a,b). This is consistent with those small systems having experienced one r-process event or none. The SFHs of UFDs typically only span 1−2 Gyr (Salvadori & Ferrara 2009; Salvadori et al. 2015; Brown et al. 2014). This does not provide any tight constraints on the timescales of the r-process. If we assume two r-process sites, one quick and one delayed, a single r-process event happening in an UFD can either belong to the quick source, or, alternatively to a rare early occurrence of the delayed source.
These small individual systems, UFDs and small dSph galaxies, therefore do not put strong constraints on the time-delay distribution of r-process events, though some information might be gained from modeling them in a statistical sense. Currently, the available evidence from UFDs and from the small dSph galaxies is thus fully consistent with our scenario of two separate r-process sources.
5. Conclusions
With the goal to investigate the timescales of the r-process, we looked at the chemical abundances and the star formation histories (SFHs) of the Milky Way solar neighborhood and the dwarf satellite galaxies. The time delay of SNIa (Fe) and AGB stars (Ba) relative to ccSN (Mg) results in the values of [Fe/Mg] and [Ba/Mg] to increase with [Fe/H] in all galaxies with SFH > 1 Gyr. On the contrary, the Milky Way and the Sculptor dSph galaxy have a relatively flat trend of [Eu/Mg] with [Fe/H], which suggests an r-process (main production site of Eu) with short timescales. However, the larger dSph galaxies, Sagittarius and Fornax have an unambiguous increase in [Eu/Mg] with [Fe/H], suggestive of a delayed r-process. The available observational data in the Local Group can therefore only be explained by (at least) two r-process sources: a quick site and a delayed site.
The quick source has to have timescales shorter than those of AGB stars and SNIa (i.e., tquick ≲ 100 Myr) to explain the flat trends in the Milky Way and Sculptor. The delayed source has to have characteristic timescales (i.e., a timescale where the majority of events occur) that are longer than the SFH of Sculptor and longer than the time since the peak in star formation rate (SFR) in the solar neighborhood. Therefore we can constrain tdelayed ≳ 4 Gyr.
The delayed r-process source is most likely neutron star mergers (NSMs) since they are confirmed r-process sites (e.g., Watson et al. 2019). The estimated time delay of the event GW170817, which is currently the only directly observed NSM with a confirmed host galaxy (Pan et al. 2017; Blanchard et al. 2017), is in good agreement with our timescale of tdelayed ≳ 4 Gyr. The quick source is less certain, but is likely associated with massive stars and could therefore be collapsars (Siegel 2019; Siegel et al. 2019) or magnetohydrodynamic (MHD) driven SN with jets and strong magnetic fields (Winteler et al. 2012). Another fast-track channel of compact object mergers is also a possibility.
The flatness of [Eu/Mg] with [Fe/H] in the Milky Way and the Sculptor dSph suggests that the quick source is the dominant r-process site in these galaxies. In general, the quick source is expected to be dominant in systems that have either a uniquely old stellar population (Sculptor) or an increasing SFH over cosmic time (the Milky Way), in other words, systems where the chemical enrichment of each population is dominated by stars ≲4 Gyr younger. The chemical contribution of the delayed source is only unambiguous in the larger dSph galaxies, Sagittarius and Fornax. This suggests that galaxies that are dominated by an old stellar population and have extended SFHs (> 4 Gyr) are most likely to show the chemical signatures of neutron star mergers.
Our proposed scenario of two r-process sources, a quick and a delayed source, is able to self-consistently explain the chemical abundance pattern observed in the Milky Way and all its dwarf satellite galaxies. Furthermore, it is supported by measurements of [Eu/Mg] in solar twins with high-precision astroseismic age measurements.
Our simple and schematic approach can (and should be) extended to include detailed chemical evolution models of the Milky Way, its different Galactic components, and its dwarf galaxy satellites. By combining self-consistent chemical evolution models with the large amount of available and upcoming data (e.g., Dalton et al. 2016; Jönsson et al. 2018; Buder et al. 2018; de Jong et al. 2019), we will be able to further test our proposed scenario and put stronger constraints on the complicated timescales of the r-process.
∼94% of the Eu solar abundance comes from the r-process, according to Bisterzo et al. (2014).
Acknowledgments
The authors would like to thank Mayte Alfaro Cuello, Moritz Reichert and Thomas de Boer for readily sharing their results with us. This project has received funding from the European Research Council (ERC) under the European Union’s Horizon 2020 research and innovation programme (grant agreement No. 804240).
References
- Abbott, B. P., Abbott, R., Abbott, T. D., et al. 2017a, Phys. Rev. Lett., 119, 161101 [NASA ADS] [CrossRef] [PubMed] [Google Scholar]
- Abbott, B. P., Abbott, R., Abbott, T. D., et al. 2017b, ApJ, 848, L13 [NASA ADS] [CrossRef] [Google Scholar]
- Abbott, B. P., Abbott, R., Abbott, T. D., et al. 2017c, ApJ, 848, L12 [Google Scholar]
- Alfaro-Cuello, M., Kacharov, N., Neumayer, N., et al. 2019, ApJ, 886, 57 [NASA ADS] [CrossRef] [Google Scholar]
- Amarsi, A. M., Nissen, P. E., & Skúladóttir, Á. 2019, A&A, 630, A104 [NASA ADS] [CrossRef] [EDP Sciences] [Google Scholar]
- Bedell, M., Bean, J. L., Meléndez, J., et al. 2018, ApJ, 865, 68 [NASA ADS] [CrossRef] [Google Scholar]
- Berger, E. 2014, ARA&A, 52, 43 [NASA ADS] [CrossRef] [Google Scholar]
- Bernard, E. J. 2018, in Rediscovering Our Galaxy, eds. C. Chiappini, I. Minchev, E. Starkenburg, & M. Valentini, IAU Symp., 334, 158 [NASA ADS] [Google Scholar]
- Bettinelli, M., Hidalgo, S. L., Cassisi, S., et al. 2019, MNRAS, 487, 5862 [NASA ADS] [CrossRef] [Google Scholar]
- Bisterzo, S., Travaglio, C., Gallino, R., Wiescher, M., & Käppeler, F. 2014, ApJ, 787, 10 [NASA ADS] [CrossRef] [Google Scholar]
- Blanchard, P. K., Berger, E., Fong, W., et al. 2017, ApJ, 848, L22 [NASA ADS] [CrossRef] [Google Scholar]
- Bonetti, M., Perego, A., Dotti, M., & Cescutti, G. 2019, MNRAS, 490, 296 [NASA ADS] [CrossRef] [Google Scholar]
- Bonifacio, P., Hill, V., Molaro, P., et al. 2000, A&A, 359, 663 [NASA ADS] [Google Scholar]
- Brown, T. M., Tumlinson, J., Geha, M., et al. 2014, ApJ, 796, 91 [NASA ADS] [CrossRef] [Google Scholar]
- Buder, S., Asplund, M., Duong, L., et al. 2018, MNRAS, 478, 4513 [NASA ADS] [CrossRef] [Google Scholar]
- Chornock, R., Berger, E., Kasen, D., et al. 2017, ApJ, 848, L19 [NASA ADS] [CrossRef] [Google Scholar]
- Cignoni, M., Degl’Innocenti, S., Prada Moroni, P. G., & Shore, S. N. 2006, A&A, 459, 783 [Google Scholar]
- Cohen, J. G., & Huang, W. 2009, ApJ, 701, 1053 [NASA ADS] [CrossRef] [Google Scholar]
- Cohen, J. G., & Huang, W. 2010, ApJ, 719, 931 [NASA ADS] [CrossRef] [Google Scholar]
- Côté, B., Eichler, M., Arcones, A., et al. 2019, ApJ, 875, 106 [NASA ADS] [CrossRef] [Google Scholar]
- Coulter, D. A., Foley, R. J., Kilpatrick, C. D., et al. 2017, Science, 358, 1556 [NASA ADS] [CrossRef] [Google Scholar]
- Cowperthwaite, P. S., Berger, E., Villar, V. A., et al. 2017, ApJ, 848, L17 [NASA ADS] [CrossRef] [Google Scholar]
- Dalton, G., Trager, S., Abrams, D. C., et al. 2016, in Final Design and Progress of WEAVE: The Next Generation Wide-field Spectroscopy Facility for the William Herschel Telescope, SPIE Conf. Ser., 9908, 99081G [Google Scholar]
- de Boer, T. J. L., Tolstoy, E., Hill, V., et al. 2012a, A&A, 544, A73 [NASA ADS] [CrossRef] [EDP Sciences] [Google Scholar]
- de Boer, T. J. L., Tolstoy, E., Hill, V., et al. 2012b, A&A, 539, A103 [NASA ADS] [CrossRef] [EDP Sciences] [Google Scholar]
- de Boer, T. J. L., Belokurov, V., & Koposov, S. 2015, MNRAS, 451, 3489 [NASA ADS] [CrossRef] [Google Scholar]
- de Jong, R. S., Agertz, O., Berbel, A. A., et al. 2019, The Messenger, 175, 3 [NASA ADS] [Google Scholar]
- Drout, M. R., Piro, A. L., Shappee, B. J., et al. 2017, Science, 358, 1570 [NASA ADS] [CrossRef] [Google Scholar]
- Feuillet, D. K., Frankel, N., Lind, K., et al. 2019, MNRAS, 489, 1742 [NASA ADS] [CrossRef] [Google Scholar]
- Fong, W., Berger, E., Blanchard, P. K., et al. 2017, ApJ, 848, L23 [NASA ADS] [CrossRef] [Google Scholar]
- François, P., Depagne, E., Hill, V., et al. 2007, A&A, 476, 935 [NASA ADS] [CrossRef] [EDP Sciences] [Google Scholar]
- Frebel, A., Simon, J. D., Geha, M., & Willman, B. 2010, ApJ, 708, 560 [NASA ADS] [CrossRef] [Google Scholar]
- Frebel, A., Simon, J. D., & Kirby, E. N. 2014, ApJ, 786, 74 [NASA ADS] [CrossRef] [Google Scholar]
- García, R. A., & Ballot, J. 2019, Liv. Rev. Sol. Phys., 16, 4 [CrossRef] [Google Scholar]
- Grisoni, V., Cescutti, G., Matteucci, F., et al. 2020, MNRAS, 492, 2828 [NASA ADS] [CrossRef] [Google Scholar]
- Hampel, M., Stancliffe, R. J., Lugaro, M., & Meyer, B. S. 2016, ApJ, 831, 171 [NASA ADS] [CrossRef] [Google Scholar]
- Hansen, T. T., Andersen, J., Nordström, B., et al. 2016, A&A, 588, A3 [NASA ADS] [CrossRef] [EDP Sciences] [Google Scholar]
- Hansen, C. J., El-Souri, M., Monaco, L., et al. 2018, ApJ, 855, 83 [NASA ADS] [CrossRef] [Google Scholar]
- Helmi, A., Babusiaux, C., Koppelman, H. H., et al. 2018, Nature, 563, 85 [NASA ADS] [CrossRef] [Google Scholar]
- Hill, V., Skúladóttir, Á., Tolstoy, E., et al. 2019, A&A, 626, A15 [NASA ADS] [CrossRef] [EDP Sciences] [Google Scholar]
- Hotokezaka, K., Beniamini, P., & Piran, T. 2018, Int. J. Mod. Phys. D, 27, 1842005 [NASA ADS] [CrossRef] [Google Scholar]
- Isern, J. 2019, ApJ, 878, L11 [NASA ADS] [CrossRef] [Google Scholar]
- Ji, A. P., Frebel, A., Chiti, A., & Simon, J. D. 2016a, Nature, 531, 610 [NASA ADS] [CrossRef] [PubMed] [Google Scholar]
- Ji, A. P., Frebel, A., Simon, J. D., & Chiti, A. 2016b, ApJ, 830, 93 [NASA ADS] [CrossRef] [Google Scholar]
- Ji, A. P., Simon, J. D., Frebel, A., Venn, K. A., & Hansen, T. T. 2019, ApJ, 870, 83 [NASA ADS] [CrossRef] [Google Scholar]
- Jönsson, H., Allende Prieto, C., Holtzman, J. A., et al. 2018, AJ, 156, 126 [NASA ADS] [CrossRef] [Google Scholar]
- Karakas, A. I., & Lattanzio, J. C. 2014, PASA, 31, e030 [NASA ADS] [CrossRef] [Google Scholar]
- Komiya, Y., & Shigeyama, T. 2016, ApJ, 830, 76 [NASA ADS] [CrossRef] [Google Scholar]
- Lucatello, S., Tsangarides, S., Beers, T. C., et al. 2005, ApJ, 625, 825 [NASA ADS] [CrossRef] [Google Scholar]
- Maoz, D., Mannucci, F., & Nelemans, G. 2014, ARA&A, 52, 107 [NASA ADS] [CrossRef] [Google Scholar]
- McWilliam, A., Wallerstein, G., & Mottini, M. 2013, ApJ, 778, 149 [NASA ADS] [CrossRef] [Google Scholar]
- Mishenina, T. V., Pignatari, M., Korotin, S. A., et al. 2013, A&A, 552, A128 [NASA ADS] [CrossRef] [EDP Sciences] [Google Scholar]
- Mor, R., Robin, A. C., Figueras, F., Roca-Fàbrega, S., & Luri, X. 2019, A&A, 624, L1 [NASA ADS] [CrossRef] [EDP Sciences] [Google Scholar]
- Nissen, P. E., & Gustafsson, B. 2018, A&ARv, 26, 6 [NASA ADS] [CrossRef] [Google Scholar]
- Nomoto, K., Kobayashi, C., & Tominaga, N. 2013, ARA&A, 51, 457 [NASA ADS] [CrossRef] [Google Scholar]
- Norris, J. E., Yong, D., Venn, K. A., et al. 2017, ApJS, 230, 28 [NASA ADS] [CrossRef] [Google Scholar]
- Pan, Y. C., Kilpatrick, C. D., Simon, J. D., et al. 2017, ApJ, 848, L30 [NASA ADS] [CrossRef] [Google Scholar]
- Pian, E., D’Avanzo, P., Benetti, S., et al. 2017, Nature, 551, 67 [NASA ADS] [CrossRef] [Google Scholar]
- Raiteri, C. M., Villata, M., & Navarro, J. F. 1996, A&A, 315, 105 [NASA ADS] [Google Scholar]
- Reichert, M., Hansen, C. J., Hanke, M., et al. 2019, A&A, submitted [Google Scholar]
- Roederer, I. U., & Kirby, E. N. 2014, MNRAS, 440, 2665 [NASA ADS] [CrossRef] [Google Scholar]
- Roederer, I. U., Preston, G. W., Thompson, I. B., Shectman, S. A., & Sneden, C. 2014a, ApJ, 784, 158 [NASA ADS] [CrossRef] [Google Scholar]
- Roederer, I. U., Preston, G. W., Thompson, I. B., et al. 2014b, AJ, 147, 136 [NASA ADS] [CrossRef] [Google Scholar]
- Sadakane, K., Arimoto, N., Ikuta, C., et al. 2004, PASJ, 56, 1041 [NASA ADS] [Google Scholar]
- Salvadori, S., & Ferrara, A. 2009, MNRAS, 395, L6 [NASA ADS] [Google Scholar]
- Salvadori, S., Ferrara, A., Schneider, R., Scannapieco, E., & Kawata, D. 2010, MNRAS, 401, L5 [NASA ADS] [Google Scholar]
- Salvadori, S., Skúladóttir, Á., & Tolstoy, E. 2015, MNRAS, 454, 1320 [NASA ADS] [CrossRef] [Google Scholar]
- Sbordone, L., Bonifacio, P., Buonanno, R., et al. 2007, A&A, 465, 815 [NASA ADS] [CrossRef] [EDP Sciences] [Google Scholar]
- Schönrich, R. A., & Weinberg, D. H. 2019, MNRAS, 487, 580 [NASA ADS] [CrossRef] [Google Scholar]
- Shen, S., Cooke, R. J., Ramirez-Ruiz, E., et al. 2015, ApJ, 807, 115 [NASA ADS] [CrossRef] [Google Scholar]
- Shetrone, M. D., Côté, P., & Stetson, P. B. 2001, PASP, 113, 1122 [NASA ADS] [CrossRef] [Google Scholar]
- Shetrone, M., Venn, K. A., Tolstoy, E., et al. 2003, AJ, 125, 684 [NASA ADS] [CrossRef] [Google Scholar]
- Siegel, D. M. 2019, Eur. Phys. J. A, 55, 203 [NASA ADS] [CrossRef] [EDP Sciences] [Google Scholar]
- Siegel, D. M., Barnes, J., & Metzger, B. D. 2019, Nature, 569, 241 [NASA ADS] [CrossRef] [Google Scholar]
- Silva Aguirre, V., Bojsen-Hansen, M., Slumstrup, D., et al. 2018, MNRAS, 475, 5487 [NASA ADS] [Google Scholar]
- Simonetti, P., Matteucci, F., Greggio, L., & Cescutti, G. 2019, MNRAS, 486, 2896 [NASA ADS] [CrossRef] [Google Scholar]
- Skúladóttir, Á., Hansen, C. J., Salvadori, S., & Choplin, A. 2019, A&A, 631, A171 [NASA ADS] [CrossRef] [EDP Sciences] [Google Scholar]
- Spina, L., Meléndez, J., Karakas, A. I., et al. 2018, MNRAS, 474, 2580 [NASA ADS] [Google Scholar]
- Starkenburg, E., Shetrone, M. D., McConnachie, A. W., & Venn, K. A. 2014, MNRAS, 441, 1217 [NASA ADS] [CrossRef] [Google Scholar]
- Tanaka, M., Utsumi, Y., Mazzali, P. A., et al. 2017, PASJ, 69, 102 [NASA ADS] [Google Scholar]
- Tauris, T. M., Kramer, M., Freire, P. C. C., et al. 2017, ApJ, 846, 170 [NASA ADS] [CrossRef] [Google Scholar]
- Tolstoy, E., Hill, V., & Tosi, M. 2009, ARA&A, 47, 371 [NASA ADS] [CrossRef] [Google Scholar]
- Tsujimoto, T., Nomoto, K., Yoshii, Y., et al. 1995, MNRAS, 277, 945 [NASA ADS] [CrossRef] [Google Scholar]
- van de Voort, F., Quataert, E., Hopkins, P. F., Kereš, D., & Faucher-Giguère, C.-A. 2015, MNRAS, 447, 140 [NASA ADS] [CrossRef] [Google Scholar]
- Villar, V. A., Guillochon, J., Berger, E., et al. 2017, ApJ, 851, L21 [NASA ADS] [CrossRef] [Google Scholar]
- Watson, D., Hansen, C. J., Selsing, J., et al. 2019, Nature, 574, 497 [NASA ADS] [CrossRef] [Google Scholar]
- Winteler, C., Käppeli, R., Perego, A., et al. 2012, ApJ, 750, L22 [NASA ADS] [CrossRef] [Google Scholar]
All Tables
Slopes of [Eu/Mg] with [Fe/H] in the Milky Way and its largest dSph satellite galaxies.
All Figures
|
Fig. 1. Schematic figure of the SFHs (left) and abundance ratios (right) of the Milky Way solar neighborhood (gray), and the dSph galaxies: Sagittarius (green), Fornax (yellow), and Sculptor (blue). In the case of Sagittarius, SFHs of both the nucleus M 54 and two of its streams are shown. Two independent studies of the SFH of Sculptor are included. For references and more details see Sect. 2. |
| In the text | |
|
Fig. 2. Top panel: schematic timescales of the main nucleosynthetic sites: ccSN, SNIa and AGB stars, each labeled with a reference element. The timescales of ccSN and AGB stars are estimated from stellar lifetimes (Raiteri et al. 1996), while that of SNIa refers to the peak of the delay-time distribution function based on data and models (Maoz et al. 2014). Bottom panel: our inferred timescales of the quick and delayed r-process sources. |
| In the text | |
|
Fig. 3. Ratios of [Eu/Mg] in solar twins with different ages (Spina et al. 2018 (ages, Eu); Bedell et al. 2018 (Mg)). |
| In the text | |
Current usage metrics show cumulative count of Article Views (full-text article views including HTML views, PDF and ePub downloads, according to the available data) and Abstracts Views on Vision4Press platform.
Data correspond to usage on the plateform after 2015. The current usage metrics is available 48-96 hours after online publication and is updated daily on week days.
Initial download of the metrics may take a while.