Fig. B.3
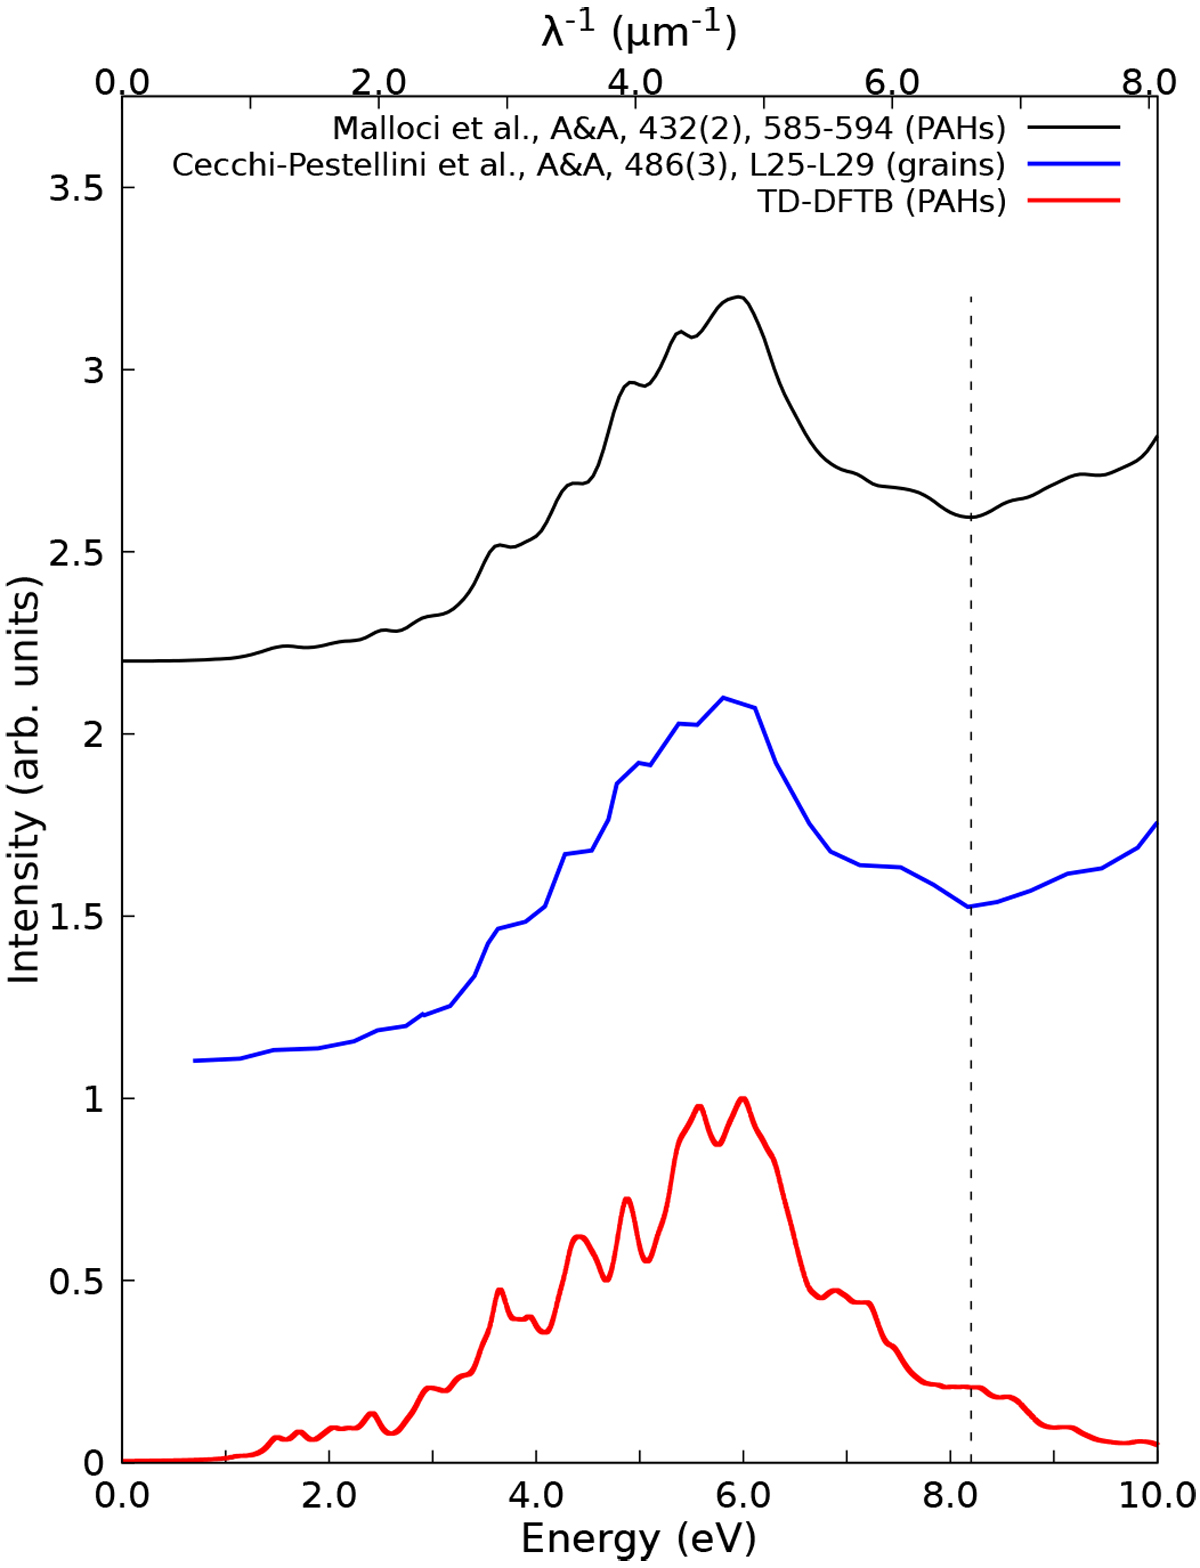
Comparison of optical spectra for the set of 40 PAH molecules investigated by Malloci et al. (2007b). The red curve corresponds to the average spectrum computed at the TD-DFTB (reduced matrix) level using the same procedure as Malloci et al. (2007b), and the FWHM of each individual band is 0.2 eV. The blue curve corresponds to the optical absorption of small PAH grains determined by Cecchi-Pestellini et al. (2008). The black curve corresponds to the average spectrum of the set of 40 PAHs computed by Malloci et al. (2007b) at the TD-LDA level. The red and black curves were normalized as proposed by these authors.
Current usage metrics show cumulative count of Article Views (full-text article views including HTML views, PDF and ePub downloads, according to the available data) and Abstracts Views on Vision4Press platform.
Data correspond to usage on the plateform after 2015. The current usage metrics is available 48-96 hours after online publication and is updated daily on week days.
Initial download of the metrics may take a while.