Fig. 1
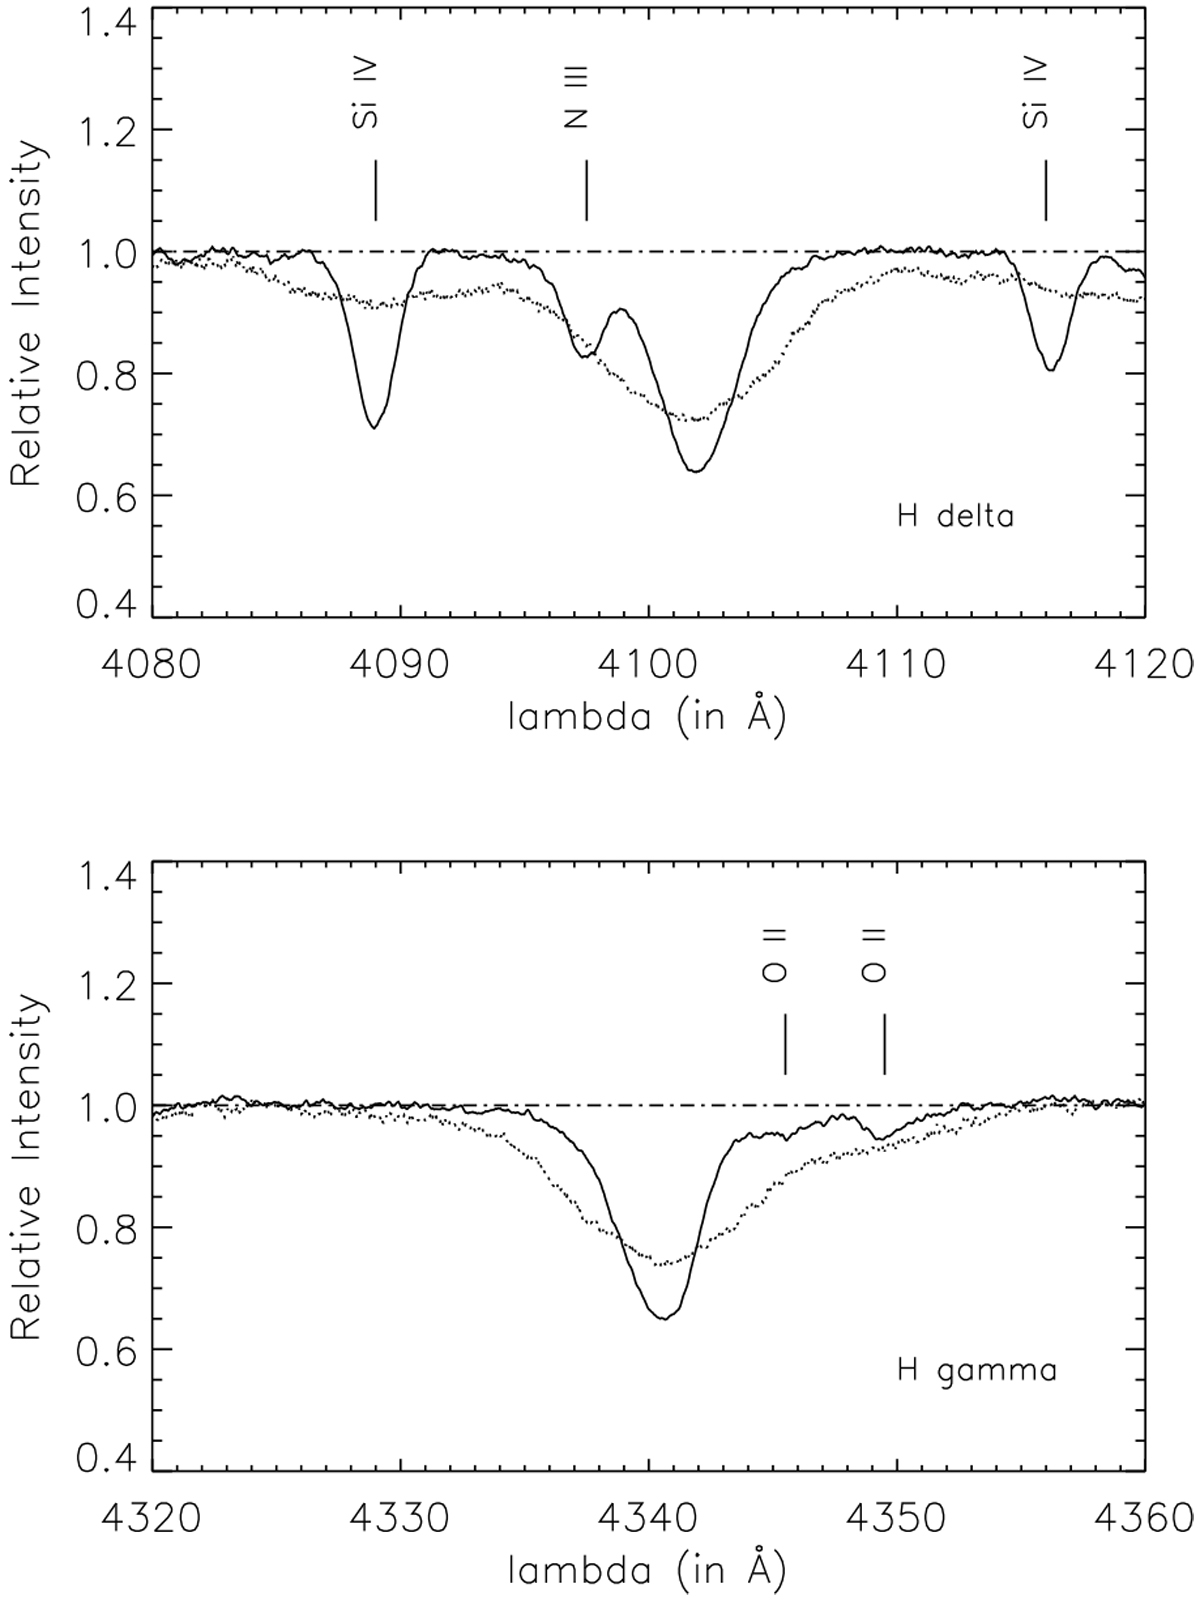
Example Hδ and Hγ lines that highlight the contributions from N III and O II in the blueward and redward wings, respectively. To clearly demonstrate the potential contamination, the displayed profiles are taken from spectra of two Galactic stars, with v sin i = 70 km s−1 (solid) and v sin i = 310 km s−1 (dotted); less severe but still problematic contributions are also present at the metallicity of the LMC.
Current usage metrics show cumulative count of Article Views (full-text article views including HTML views, PDF and ePub downloads, according to the available data) and Abstracts Views on Vision4Press platform.
Data correspond to usage on the plateform after 2015. The current usage metrics is available 48-96 hours after online publication and is updated daily on week days.
Initial download of the metrics may take a while.