Free Access
Fig. 7.
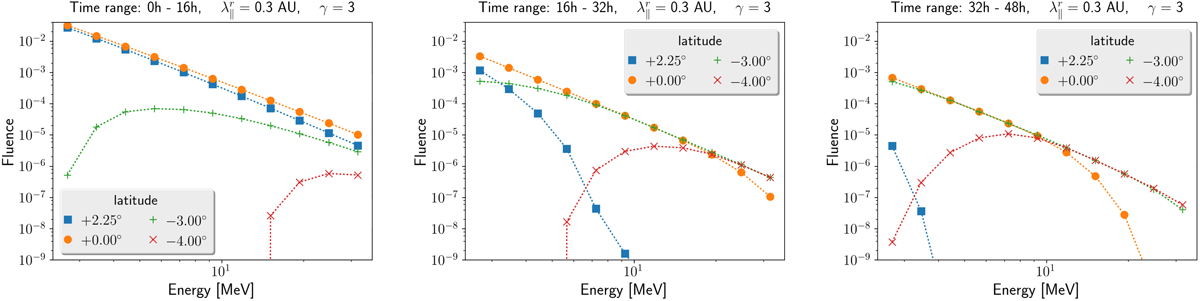
Fluence energy spectra for three different time intervals, as indicated above the figures. The energy spectra are for observers in a 700 km s−1 Parker wind located at different latitudes at 1 AU.
Current usage metrics show cumulative count of Article Views (full-text article views including HTML views, PDF and ePub downloads, according to the available data) and Abstracts Views on Vision4Press platform.
Data correspond to usage on the plateform after 2015. The current usage metrics is available 48-96 hours after online publication and is updated daily on week days.
Initial download of the metrics may take a while.