Free Access
Fig. 10.
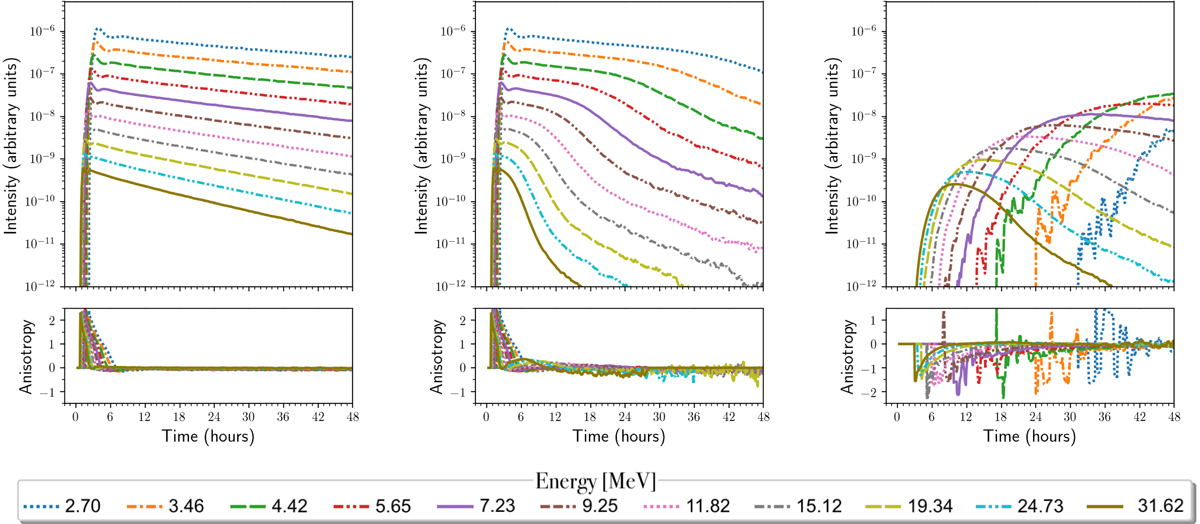
Left and central panels are the intensity-time profiles for the observer indicated by the cyan diamond in Fig. 9 for simulations without and with particle drifts, respectively. Right panel is for observer at the same longitude as the other panels yet at a latitude of −6.5° and with the effect of particle drifts included.
Current usage metrics show cumulative count of Article Views (full-text article views including HTML views, PDF and ePub downloads, according to the available data) and Abstracts Views on Vision4Press platform.
Data correspond to usage on the plateform after 2015. The current usage metrics is available 48-96 hours after online publication and is updated daily on week days.
Initial download of the metrics may take a while.