Fig. 9.
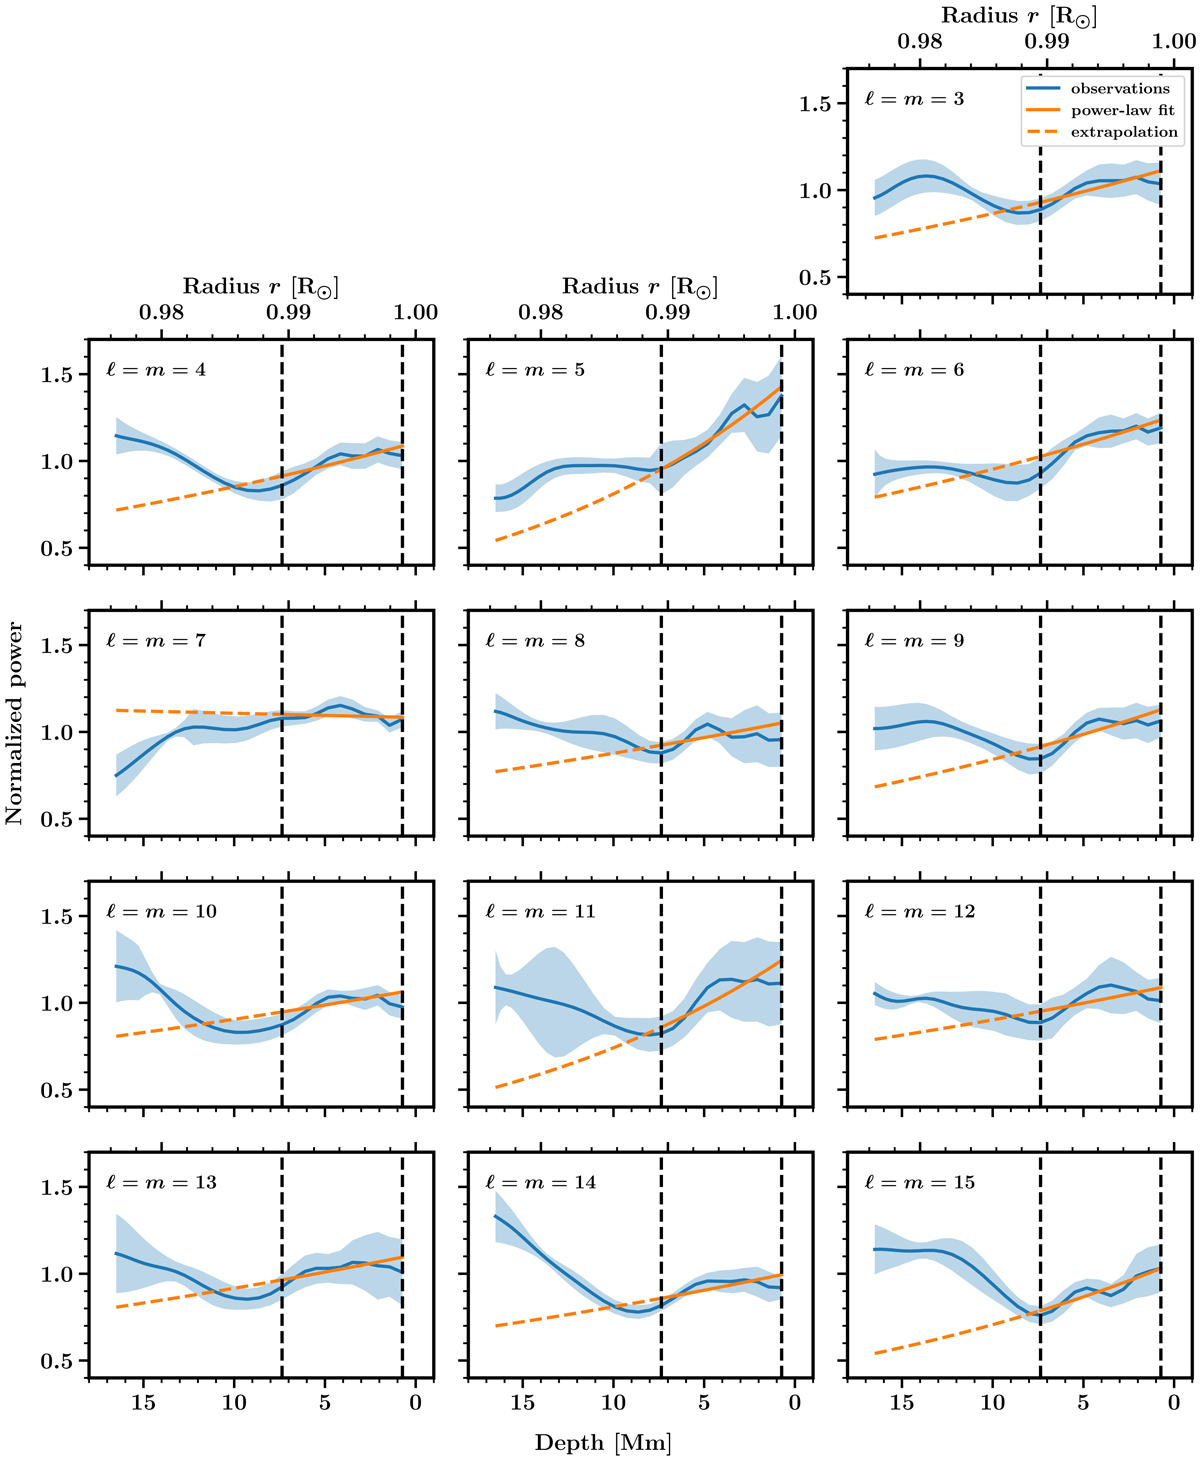
Blue lines show the Rossby wave power 𝒫signal as a function of depth for different values of m. The blue shaded areas indicate the 1σ errors. The orange curves are fits of the form const. × r2α over depths between 0.7 and 7.4 Mm (between the vertical dashed lines). The orange dashed curves are extrapolations to larger depths.
Current usage metrics show cumulative count of Article Views (full-text article views including HTML views, PDF and ePub downloads, according to the available data) and Abstracts Views on Vision4Press platform.
Data correspond to usage on the plateform after 2015. The current usage metrics is available 48-96 hours after online publication and is updated daily on week days.
Initial download of the metrics may take a while.