Fig. C.1.
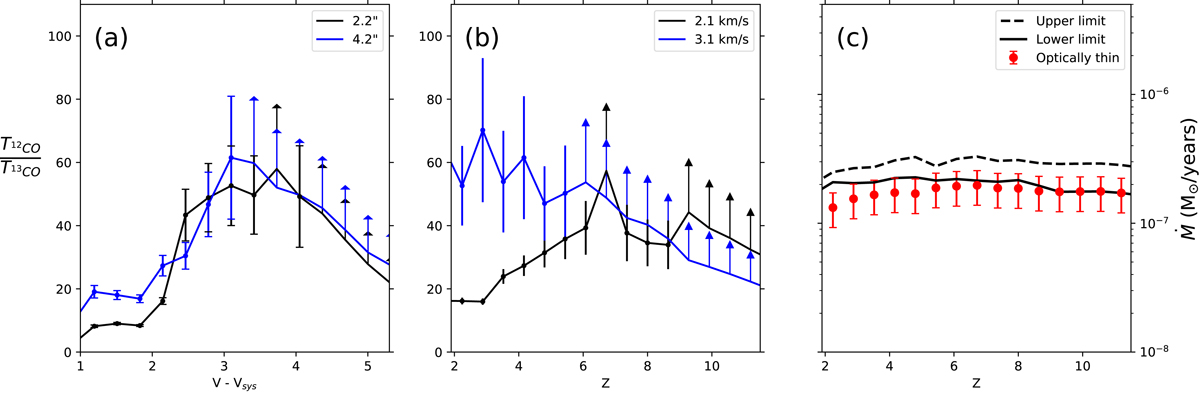
Intensity ratio between 12CO and 13CO radially averaged over the cone region: (a) as a function of the velocity on two slices of width = 0.7″ at δz = 2.2″ (black) and δz = 4.2″ (blue); and (b) as a function of height in the velocity bins (V − Vsys) = 2.15 km s−1 (blue) and (V − Vsys) = 3.1 km s−1 (black). The arrows represent the 5σ lower limit on the ratio when no 13CO is detected. (c) Resulting mass flux under different opacity hypothesis assuming optically thin 12CO (in red with errorbars at 30%), applying opacity correction based on 12CO/13CO and assuming either optically thin emission (lower limit: black solid) or the last detected value (upper limit: black dashed) when no 13CO is detected (see text for more details).
Current usage metrics show cumulative count of Article Views (full-text article views including HTML views, PDF and ePub downloads, according to the available data) and Abstracts Views on Vision4Press platform.
Data correspond to usage on the plateform after 2015. The current usage metrics is available 48-96 hours after online publication and is updated daily on week days.
Initial download of the metrics may take a while.