Fig. B.1.
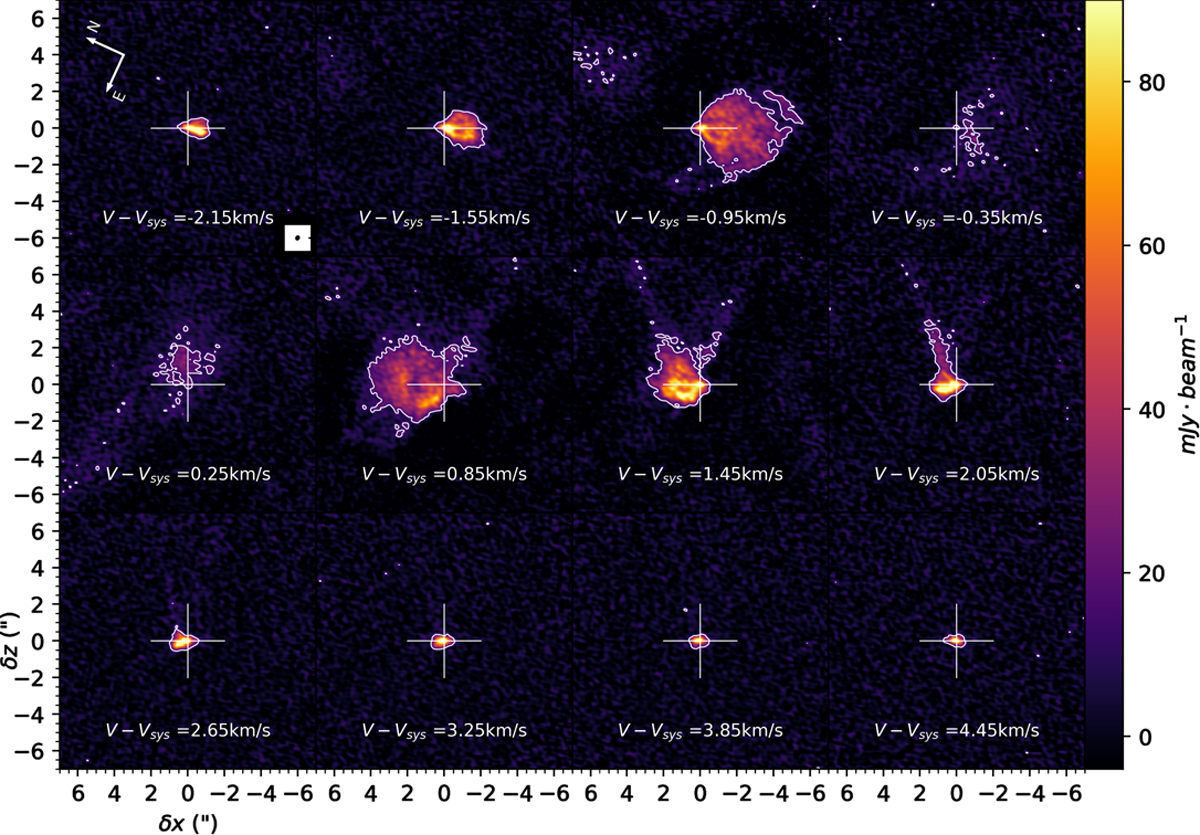
13CO selected individual channel maps. For each channel map ΔV = 0.3 km s−1 and the central velocity is indicated. The white contours trace the 3σ limit with σ = 5 mJy beam−1 (or 1.6 K). The white cross in each panel locates the central position of the continuum. The beam (0.23 ″ × 0.34″ at PA = 0.5°) is shown in the first panel.
Current usage metrics show cumulative count of Article Views (full-text article views including HTML views, PDF and ePub downloads, according to the available data) and Abstracts Views on Vision4Press platform.
Data correspond to usage on the plateform after 2015. The current usage metrics is available 48-96 hours after online publication and is updated daily on week days.
Initial download of the metrics may take a while.