Fig. 3.
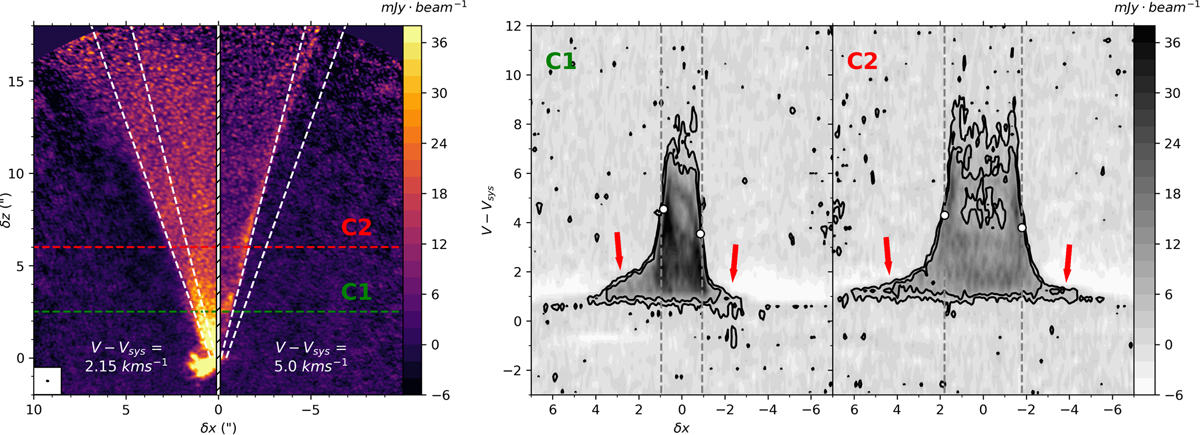
Left panel: 12CO channel maps at (V − Vsys) = 2.15 km s−1 and (V − Vsys) = 5.00 km s−1. The two white dashed lines trace the outer and inner cones (see text). Only one side of the outflow is shown in each of the two channel maps. The color scale is the same for the two channel maps. Right panel: transverse PV diagrams at δz = 2.5″ and δz = 6″ obtained along the C1 and C2 cuts shown on the channel maps and averaged on a slice of Δz = 0.2″. The black contours trace the 2σ and 5σ levels. The two white points represent the symmetric edges of the PV diagrams at δx = ±0.85″ and δx = ±1.8″, respectively. Their velocity difference gives an estimate of the rotation velocity (see text).
Current usage metrics show cumulative count of Article Views (full-text article views including HTML views, PDF and ePub downloads, according to the available data) and Abstracts Views on Vision4Press platform.
Data correspond to usage on the plateform after 2015. The current usage metrics is available 48-96 hours after online publication and is updated daily on week days.
Initial download of the metrics may take a while.