Open Access
Fig. D.1.
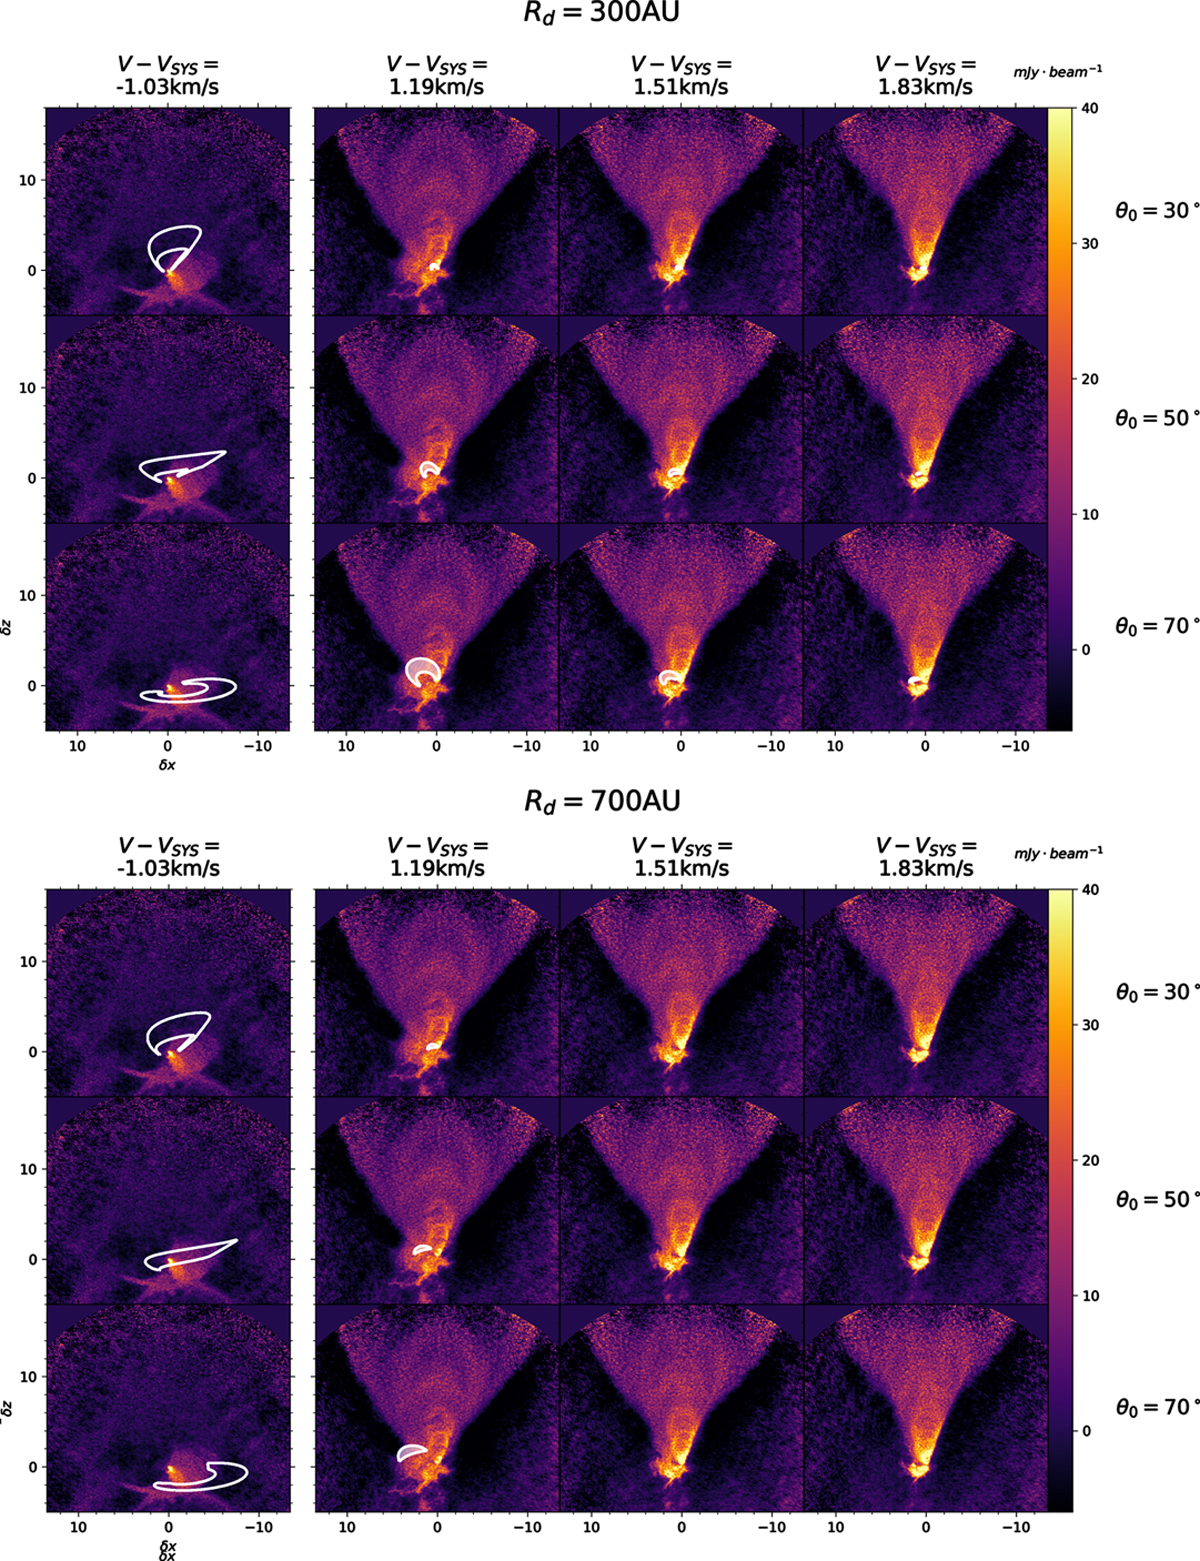
12CO selected individual channel maps. For each channel map ΔV = 0.32 km s−1 and the central velocity is indicated. Similarly to Fig. 4, the white contours trace the model of an infalling shell with rd = 300 au (top), 700 au (bottom), and θ0 = 30°, 50°, and 70°.
Current usage metrics show cumulative count of Article Views (full-text article views including HTML views, PDF and ePub downloads, according to the available data) and Abstracts Views on Vision4Press platform.
Data correspond to usage on the plateform after 2015. The current usage metrics is available 48-96 hours after online publication and is updated daily on week days.
Initial download of the metrics may take a while.