Fig. 1.
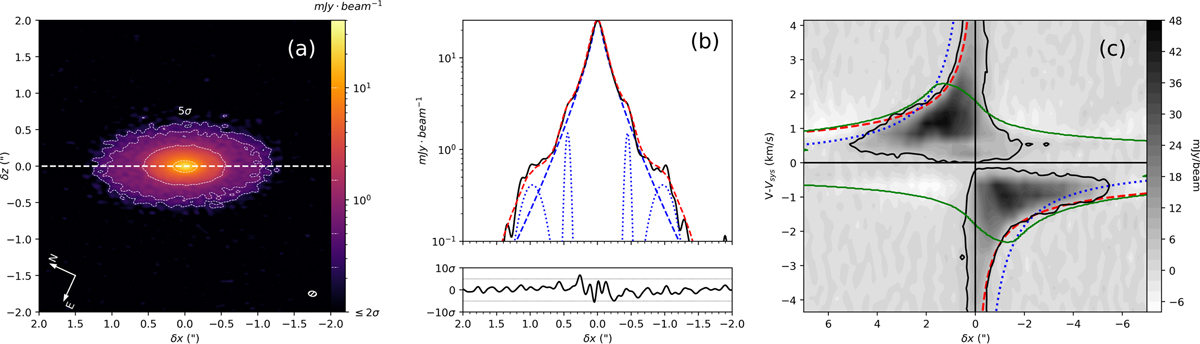
(a) Continuum map at 232 GHz in logarithmic scale. White dotted contours show the 5, 10, 30, and 200σ levels (σ = 50 μJy beam−1). The white dashed line shows the disk major axis at PA = 25.7°. (b) Continuum intensity profiles: cut along PA = 25.7° (in black) and deprojected and azimuthally averaged (in red). The tapered power law central component and the two Gaussian components, derived from the fitting and before beam convolution, are shown in blue dashed and dotted lines, respectively. Bottom panel: fit residuals and ±5σ limit (dotted lines). (c) Position-velocity diagram in 13CO along PA = 25.7° in a pseudo-slit of 4″ width. The 3σ contour is shown in black. The curves show maximum expected line-of-sight velocities Vmax for three different models: a thin disk in Keplerian rotation around M⋆ = 1.1 M⊙ at an inclination of i = 63° (red dashed line), pure rotation with constant angular momentum Vmax ∝ 1/r (blue dotted line), and a rotating and infalling bipolar shell (see Sect. 3.2.2) with Rd = 300 au, θ0 = 70° at an inclination of i = 63° (green solid line).
Current usage metrics show cumulative count of Article Views (full-text article views including HTML views, PDF and ePub downloads, according to the available data) and Abstracts Views on Vision4Press platform.
Data correspond to usage on the plateform after 2015. The current usage metrics is available 48-96 hours after online publication and is updated daily on week days.
Initial download of the metrics may take a while.