Fig. 8.
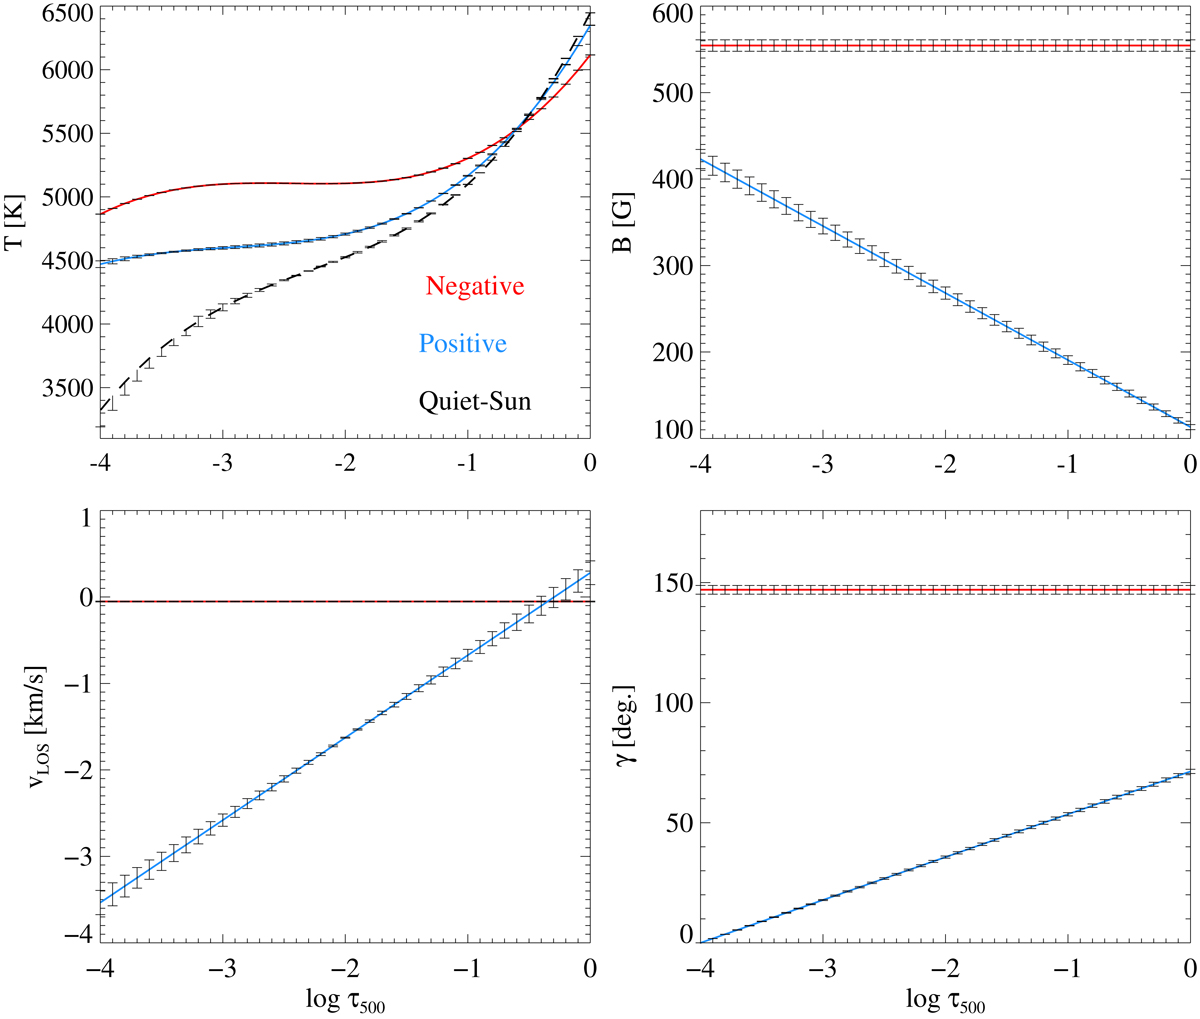
Mean values of physical parameters over the chosen SIR inversion runs on the pixels denoted with an asterisk in the last panel of Fig. 2. For all the panels blue and red represent pixels with positive and negative polarity signals, respectively. Upper left: excitation temperature variation of positive and negative polarity pixels and of the mean quiet Sun profile (black dashed line). Upper right: variation of magnetic field. Lower right: magnetic field inclination, γ, with respect to the LOS. Lower left: vLOS. Positive vLOS values represent redshifts and negative values represent blueshifts. The error bars represent standard deviation values.
Current usage metrics show cumulative count of Article Views (full-text article views including HTML views, PDF and ePub downloads, according to the available data) and Abstracts Views on Vision4Press platform.
Data correspond to usage on the plateform after 2015. The current usage metrics is available 48-96 hours after online publication and is updated daily on week days.
Initial download of the metrics may take a while.