Fig. 7.
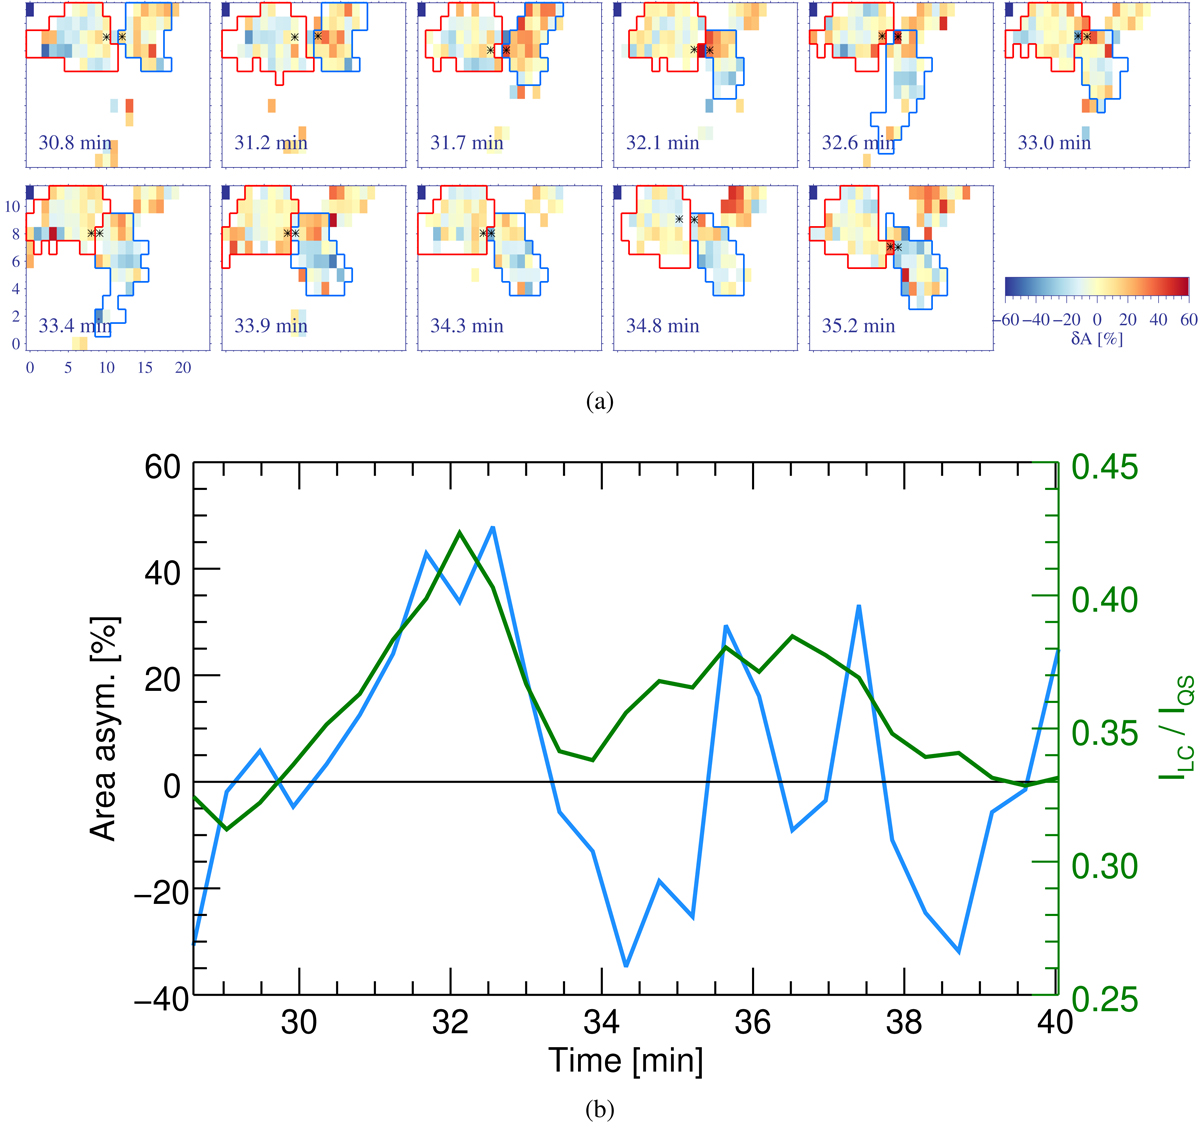
Panel a: area asymmetry maps in the interval [30.8, 35.2] min. The axes are in pixel scale (scaling: 0.135″ × 0.1875″). The red (blue) contour is for the negative (positive) patch. Asterisks represent border pixels whose area asymmetry values are plotted in panel b. Panel b: variation of area asymmetry values for border positive polarity pixels next to the PIL. The evolution of normalized line core intensity along the PIL is shown in green. The horizontal line represents zero on the area asymmetry axis.
Current usage metrics show cumulative count of Article Views (full-text article views including HTML views, PDF and ePub downloads, according to the available data) and Abstracts Views on Vision4Press platform.
Data correspond to usage on the plateform after 2015. The current usage metrics is available 48-96 hours after online publication and is updated daily on week days.
Initial download of the metrics may take a while.