Open Access
Fig. 4.
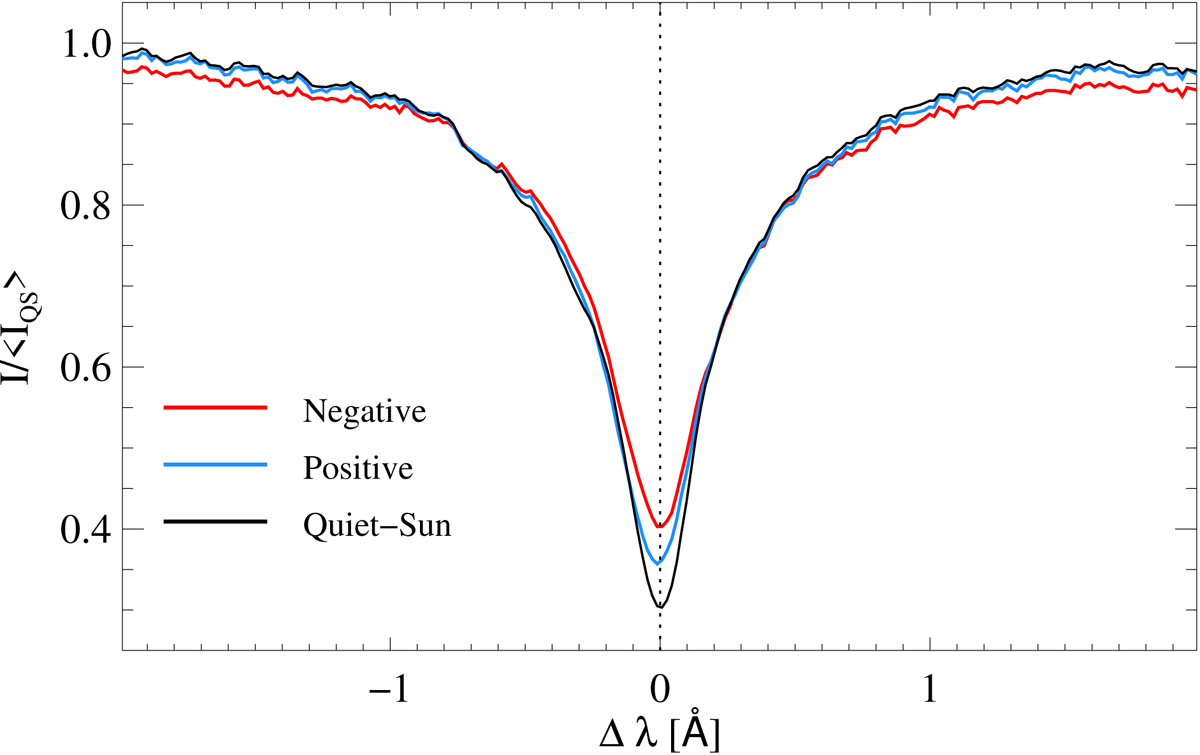
Stokes I profiles, at 32.6 min, for negative (red) and positive (blue) pixels indicated with an asterisk in Fig. 2. The black line represents the spatio-temporal mean quiet Sun profile. The vertical dotted line indicates the rest center wavelength. All the three profiles are normalized to mean quiet Sun continuum ⟨IQS⟩.
Current usage metrics show cumulative count of Article Views (full-text article views including HTML views, PDF and ePub downloads, according to the available data) and Abstracts Views on Vision4Press platform.
Data correspond to usage on the plateform after 2015. The current usage metrics is available 48-96 hours after online publication and is updated daily on week days.
Initial download of the metrics may take a while.