Fig. 2.
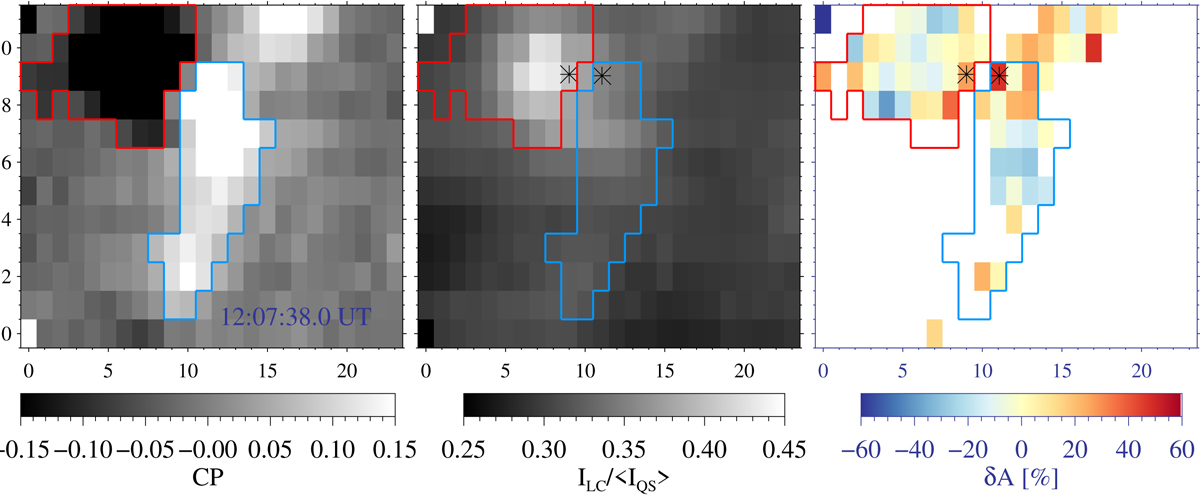
A snapshot at 32.6 min. From left to right: maps of CP, line core intensity, ILC, normalized to mean quiet Sun continuum, and area asymmetry. The white pixels in the area asymmetry map represent pixels where the maximum amplitude of Stokes V is below 5σv. The asterisk symbols in the middle and the right panels represent pixels from which the profiles in Fig. 4 are taken. The red (blue) contour is for the negative (positive) patch. The axes are in pixel scale (scaling: 0.135″ × 0.1875″). A movie of the time series is available online.
Current usage metrics show cumulative count of Article Views (full-text article views including HTML views, PDF and ePub downloads, according to the available data) and Abstracts Views on Vision4Press platform.
Data correspond to usage on the plateform after 2015. The current usage metrics is available 48-96 hours after online publication and is updated daily on week days.
Initial download of the metrics may take a while.