Fig. 2.
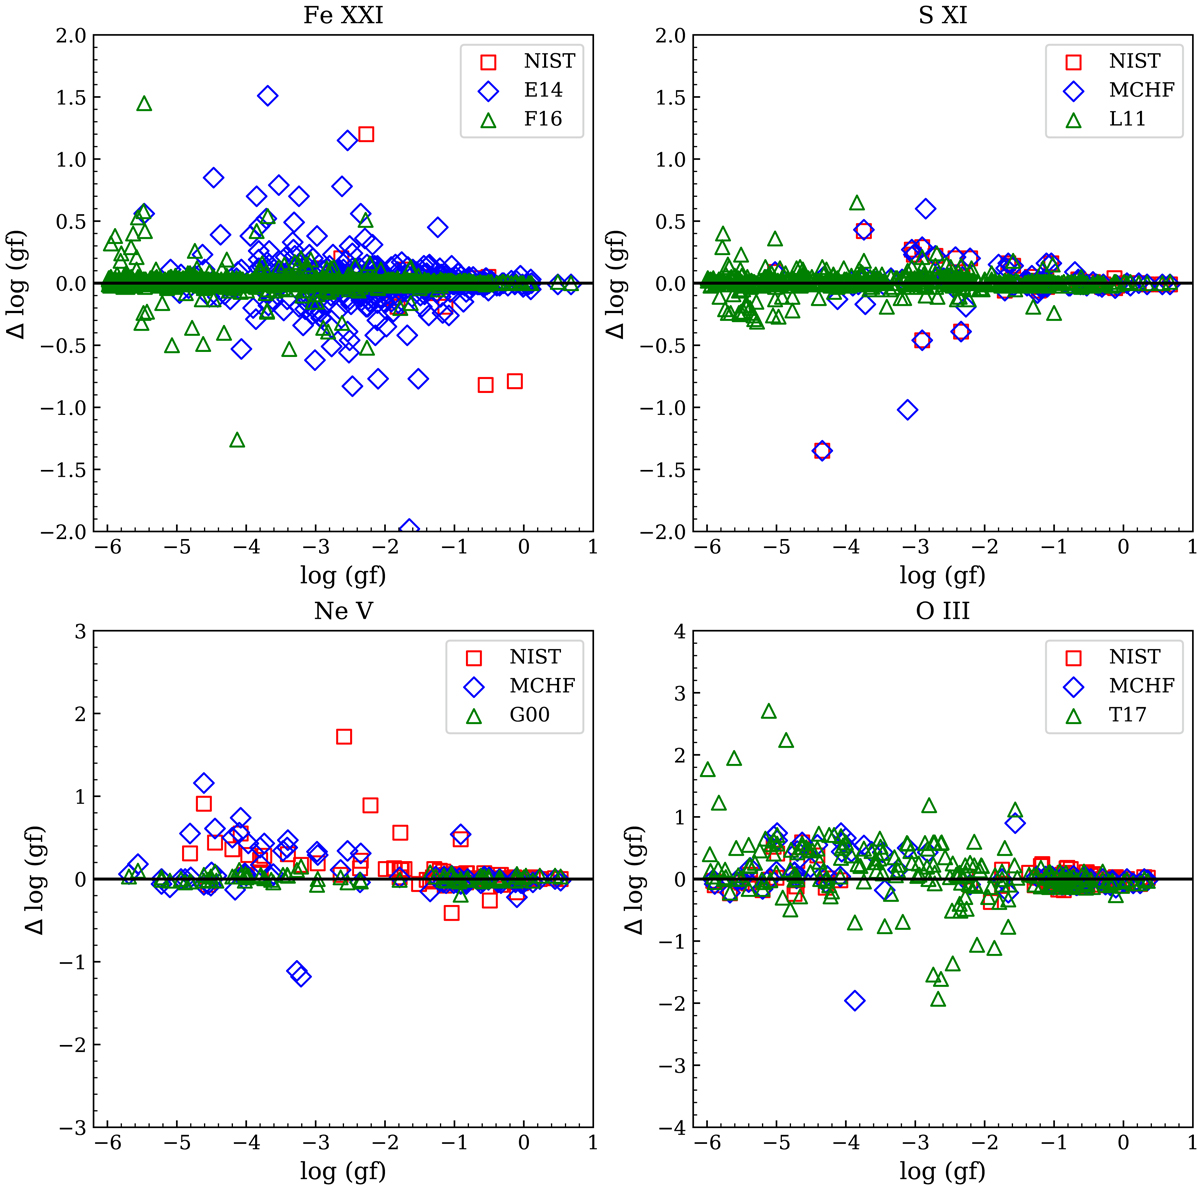
Comparisons of log (gf) from the present work (black horizontal line) with archival databases and previous works. F16 refers to Fernández-Menchero et al. (2016), E14 refers to Ekman et al. (2014), L11 refers to Liang et al. (2011), G00 refers to Griffin & Badnell (2000, OPEN-ADAS), and T17 refers to Tayal & Zatsarinny (2017). We note that this comparison is limited to relatively strong transitions with log (gf) ≳ 10−6 originating from the lowest five energy levels.
Current usage metrics show cumulative count of Article Views (full-text article views including HTML views, PDF and ePub downloads, according to the available data) and Abstracts Views on Vision4Press platform.
Data correspond to usage on the plateform after 2015. The current usage metrics is available 48-96 hours after online publication and is updated daily on week days.
Initial download of the metrics may take a while.