Fig. 13
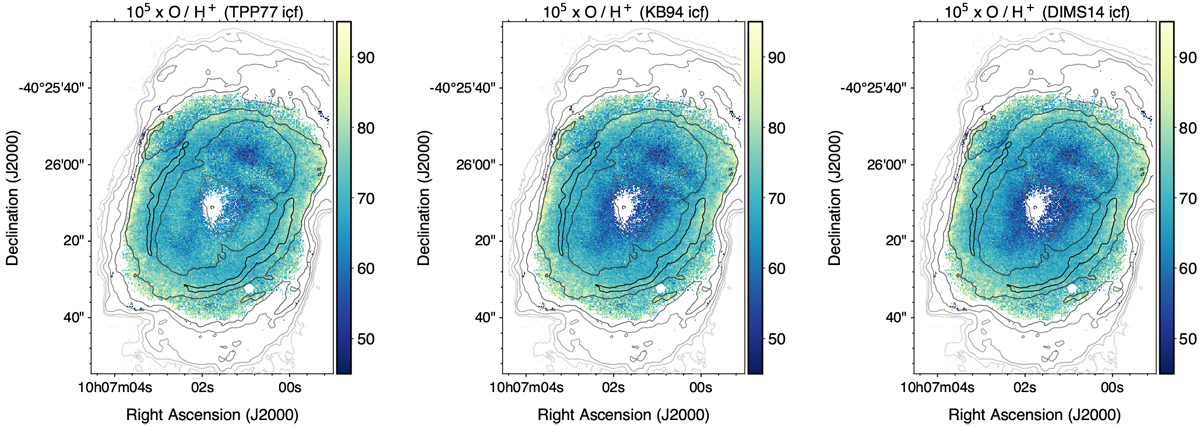
Maps of total O/H+ using the ionisation correction factors to account for the presence of O+++ as provided by Torres-Peimbert & Peimbert (1977) (left), Kingsburgh & Barlow (1994) (centre), and Delgado-Inglada et al. (2014) (right). All the three maps display the same range in abundance in order to better compare the different ionisation correction schemes.
Current usage metrics show cumulative count of Article Views (full-text article views including HTML views, PDF and ePub downloads, according to the available data) and Abstracts Views on Vision4Press platform.
Data correspond to usage on the plateform after 2015. The current usage metrics is available 48-96 hours after online publication and is updated daily on week days.
Initial download of the metrics may take a while.