Fig. 4.
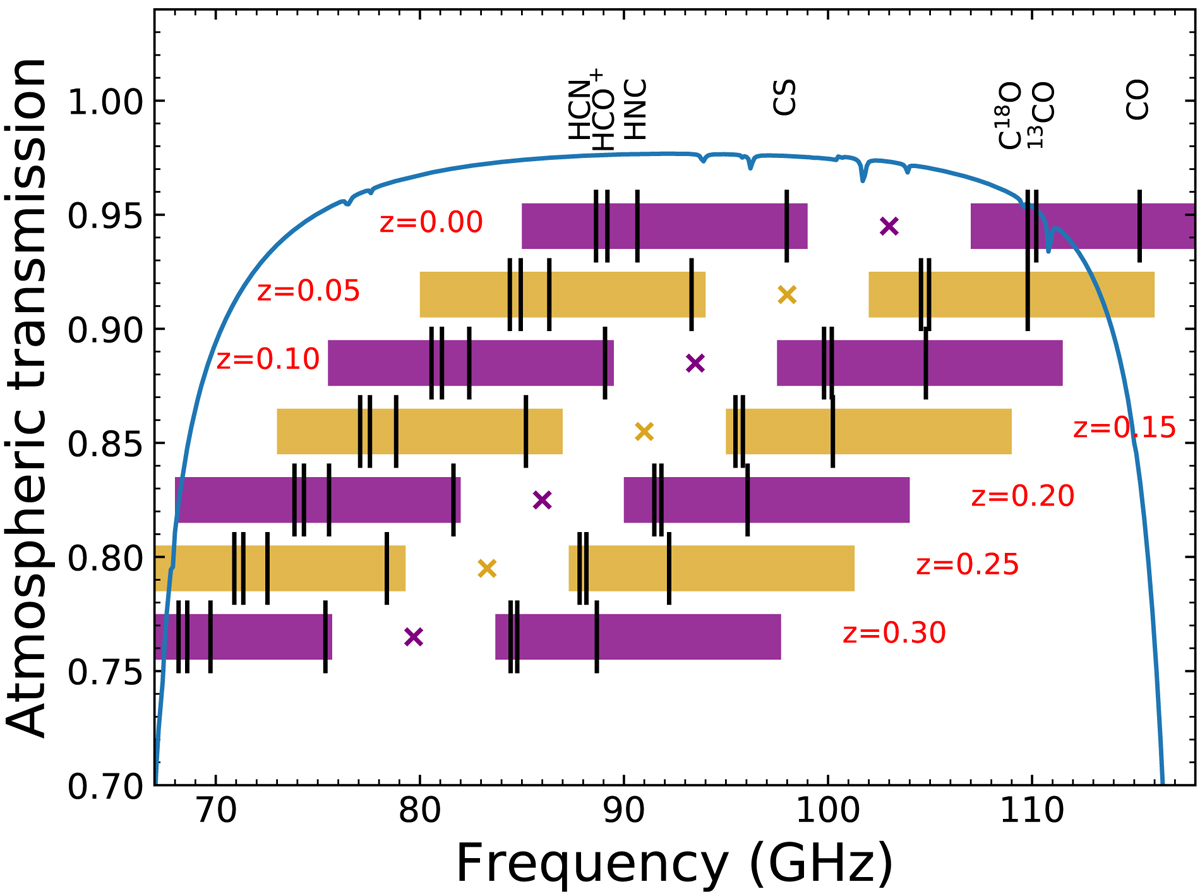
Spectral configurations assuming a 4−18 GHz IF band that allow the simultaneous observation of low density tracers (12CO(1–0), 13CO(1–0), and C18O(1–0)), and tracers of dense gas (CS(2–1), C34S(2–1), 13CS(2–1), N2H+(1–0), HNC(1–0), HCO+(1–0), and HCN(1–0)) for a range of redshifts. The vertical black lines indicate the position major spectral lines with each horizontal row corresponding to the redshift (z) indicated. The corresponding coloured bars show the sky frequency coverage of the upper and lower sidebands for the LO frequency indicated by the coloured cross. The solid blue curve shows the zenith atmospheric transmission at ALMA for a PWV value of 2 mm. Figure adapted from Mroczkowski et al. (2019a).
Current usage metrics show cumulative count of Article Views (full-text article views including HTML views, PDF and ePub downloads, according to the available data) and Abstracts Views on Vision4Press platform.
Data correspond to usage on the plateform after 2015. The current usage metrics is available 48-96 hours after online publication and is updated daily on week days.
Initial download of the metrics may take a while.