Fig. 14.
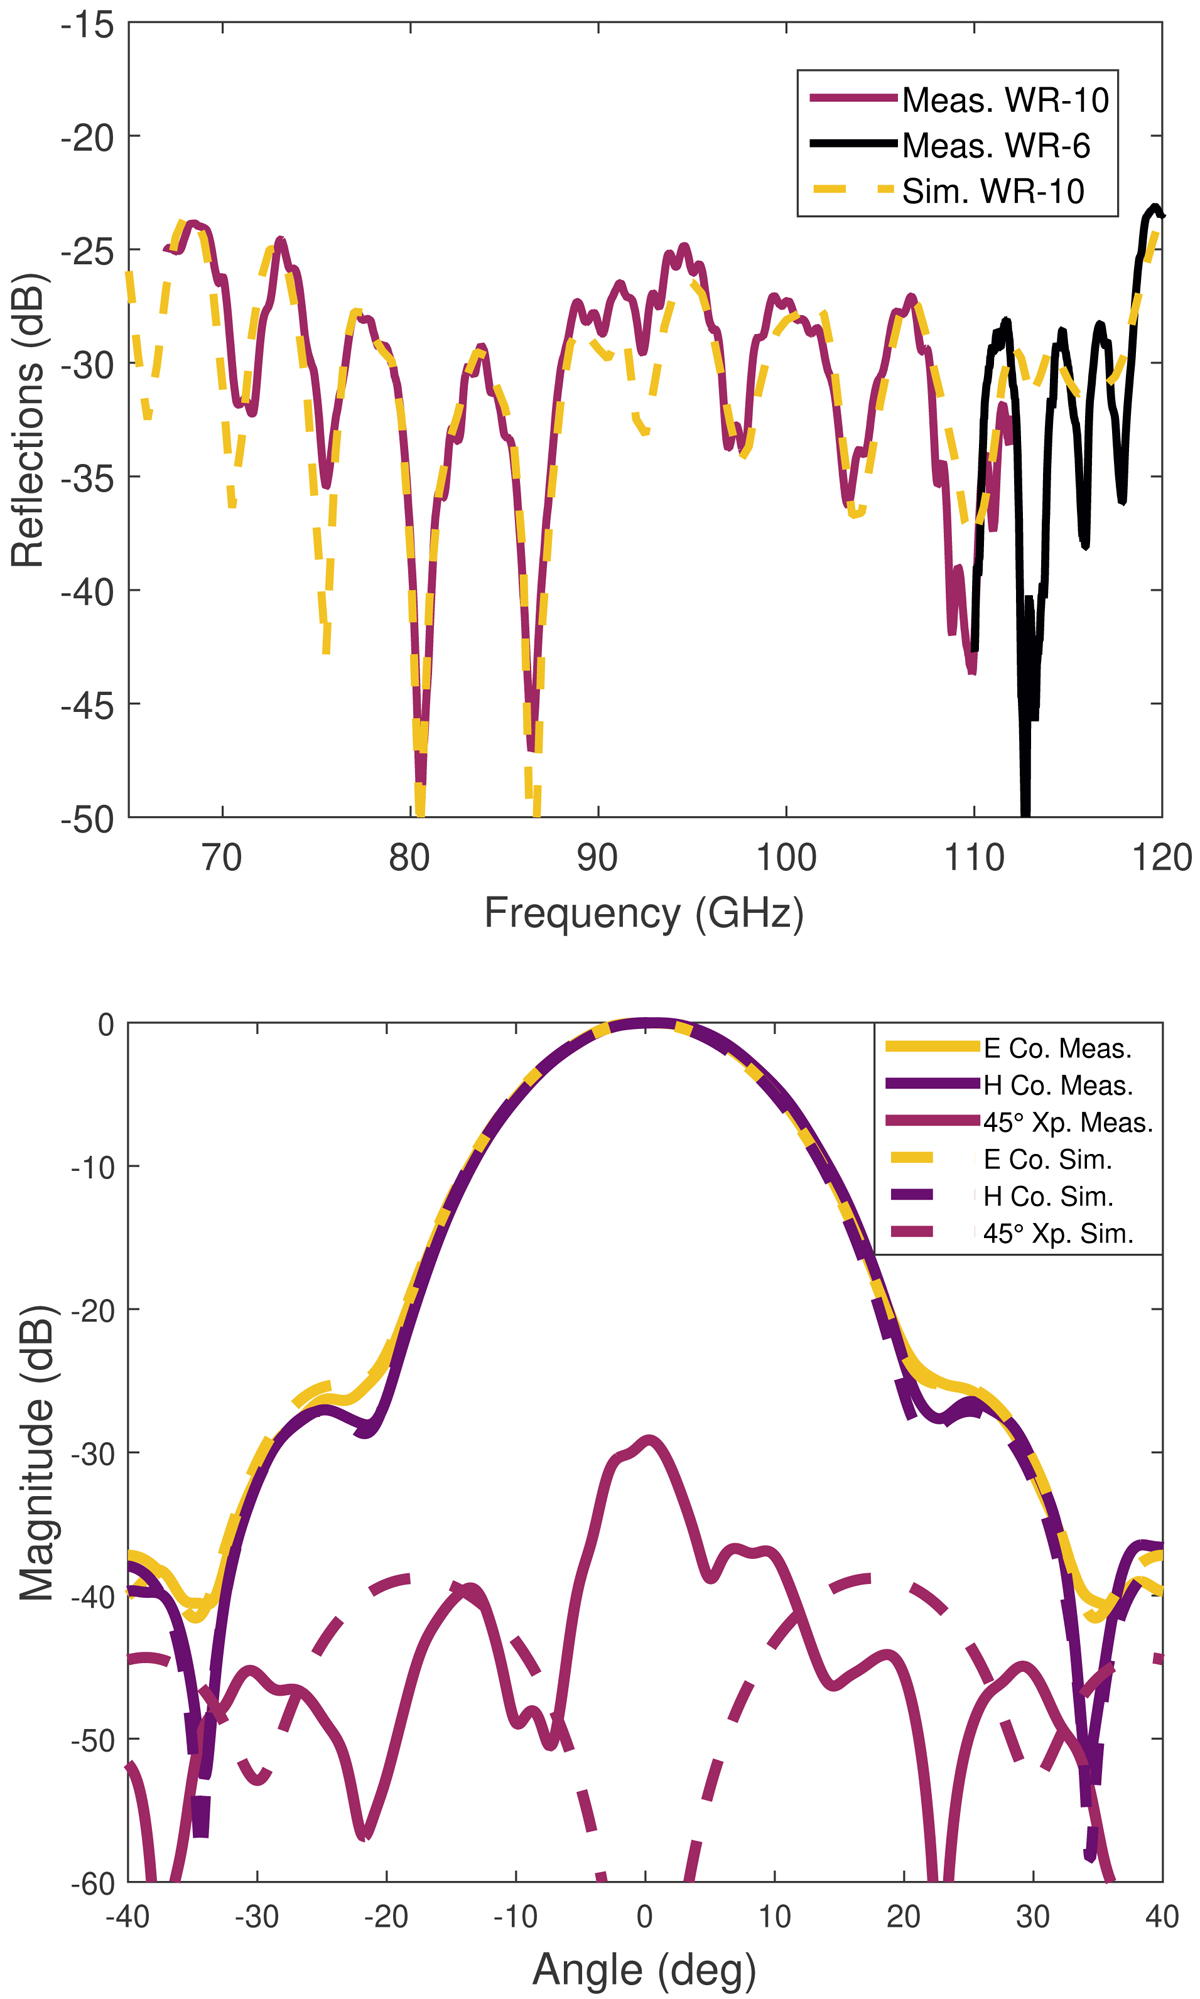
Upper panel: measured S11 for the NAOJ feedhorn design. The purple curve presents data measured directly with WR10 VNA extenders, whereas the black curve (> 110 GHz) shows data taken with WR6 extenders and waveguide transitions and are affected by the S11 of the additional transitions. Lower panel: comparison of the NAOJ feedhorn beam pattern from simulations and measurements at 95 GHz, close to the central frequency of 91.5 GHz. Our EM simulations confirm that the beam properties scale smoothly as a function of wavelength, and hence we only show one representative frequency.
Current usage metrics show cumulative count of Article Views (full-text article views including HTML views, PDF and ePub downloads, according to the available data) and Abstracts Views on Vision4Press platform.
Data correspond to usage on the plateform after 2015. The current usage metrics is available 48-96 hours after online publication and is updated daily on week days.
Initial download of the metrics may take a while.