Fig. 1.
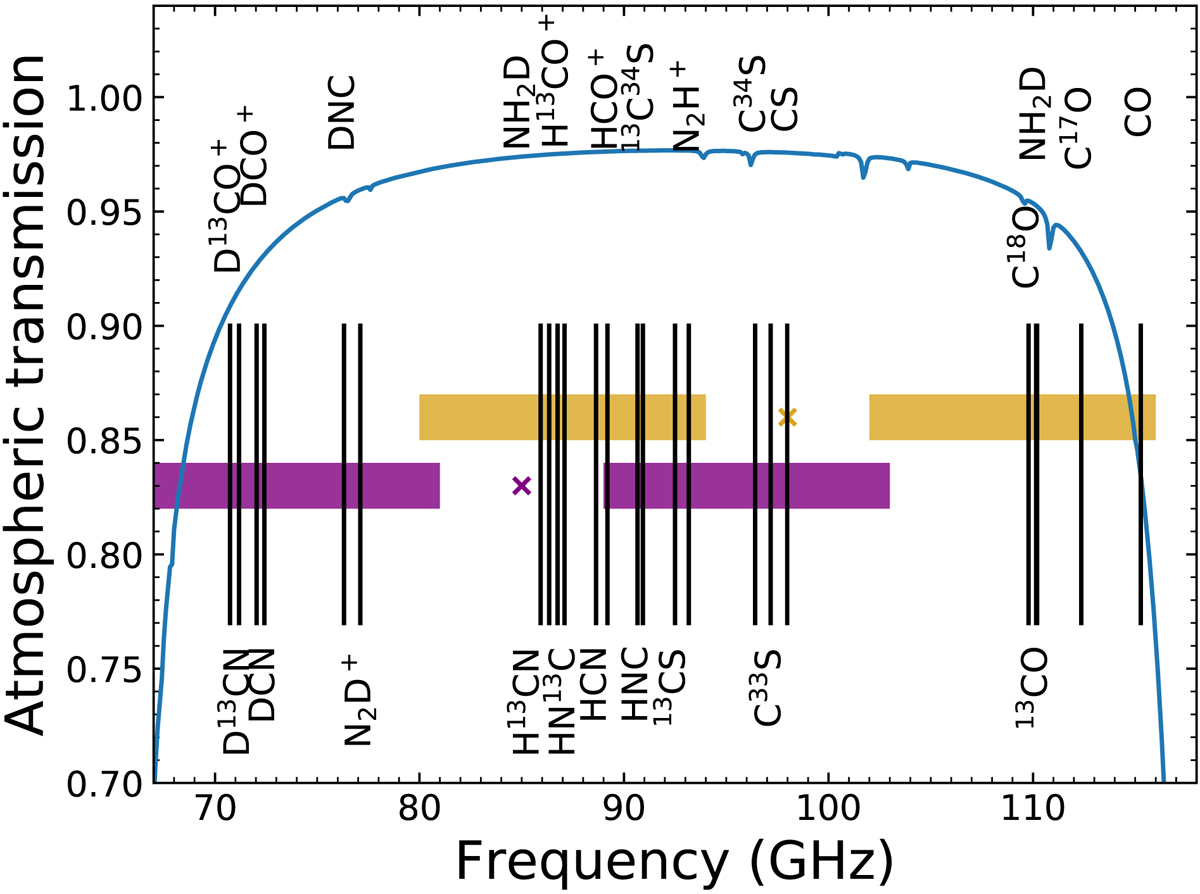
Two example spectral setups of the wide RF+IF Band 2 receiver presented here that would cover the entire 67−116 GHz atmospheric window. The x-axis shows the frequency and the horizontal coloured bars show the upper and lower sideband frequency ranges for two distinct LO settings (“x” markers at 85 and 98 GHz on the plot), one shown in purple and the other in gold. The LO frequency is marked by the coloured cross in each case. The blue curve shows the typical zenith atmospheric transmission assuming the PWV is 2 mm. The vertical black lines denote the frequencies of some molecular transitions in the band. The full band can be explored in only two spectral setups, assuming the backend digitisation and correlation hardware is upgraded to match the receiver output. Figure adapted from Mroczkowski et al. (2019a).
Current usage metrics show cumulative count of Article Views (full-text article views including HTML views, PDF and ePub downloads, according to the available data) and Abstracts Views on Vision4Press platform.
Data correspond to usage on the plateform after 2015. The current usage metrics is available 48-96 hours after online publication and is updated daily on week days.
Initial download of the metrics may take a while.