Free Access
Fig. 3.
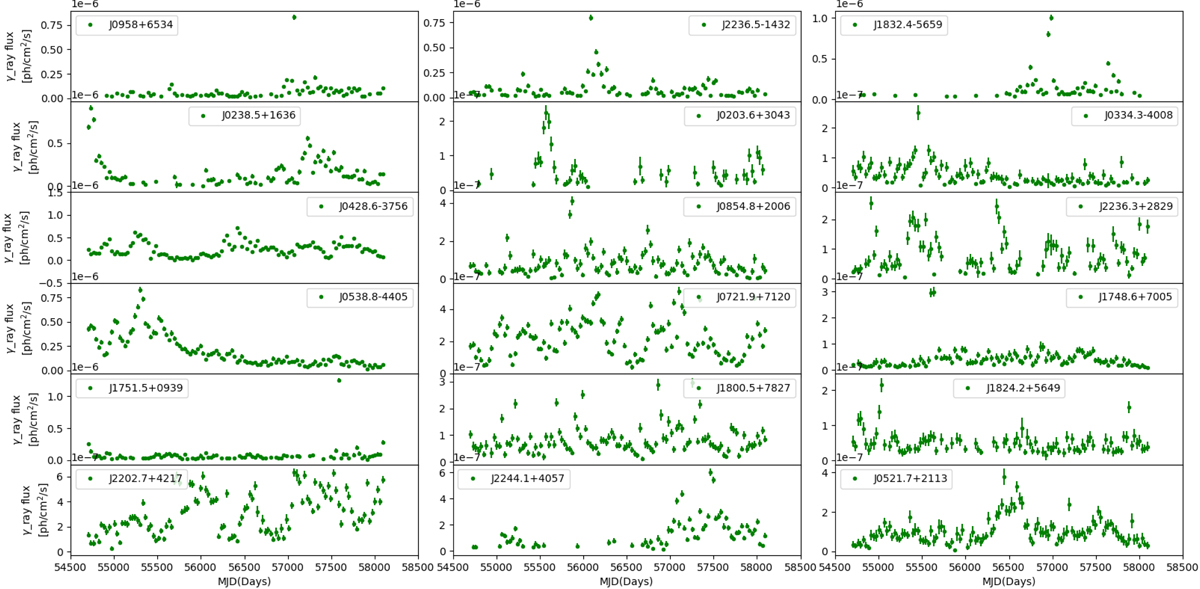
Example monthly binned light curves (TS > 9) along with their 1σ errors for BL Lacs. The names of the sources are given in each panel. Each point in the light curves refers to flux measured in the 100 MeV–300 GeV band.
Current usage metrics show cumulative count of Article Views (full-text article views including HTML views, PDF and ePub downloads, according to the available data) and Abstracts Views on Vision4Press platform.
Data correspond to usage on the plateform after 2015. The current usage metrics is available 48-96 hours after online publication and is updated daily on week days.
Initial download of the metrics may take a while.