Free Access
Fig. 1.
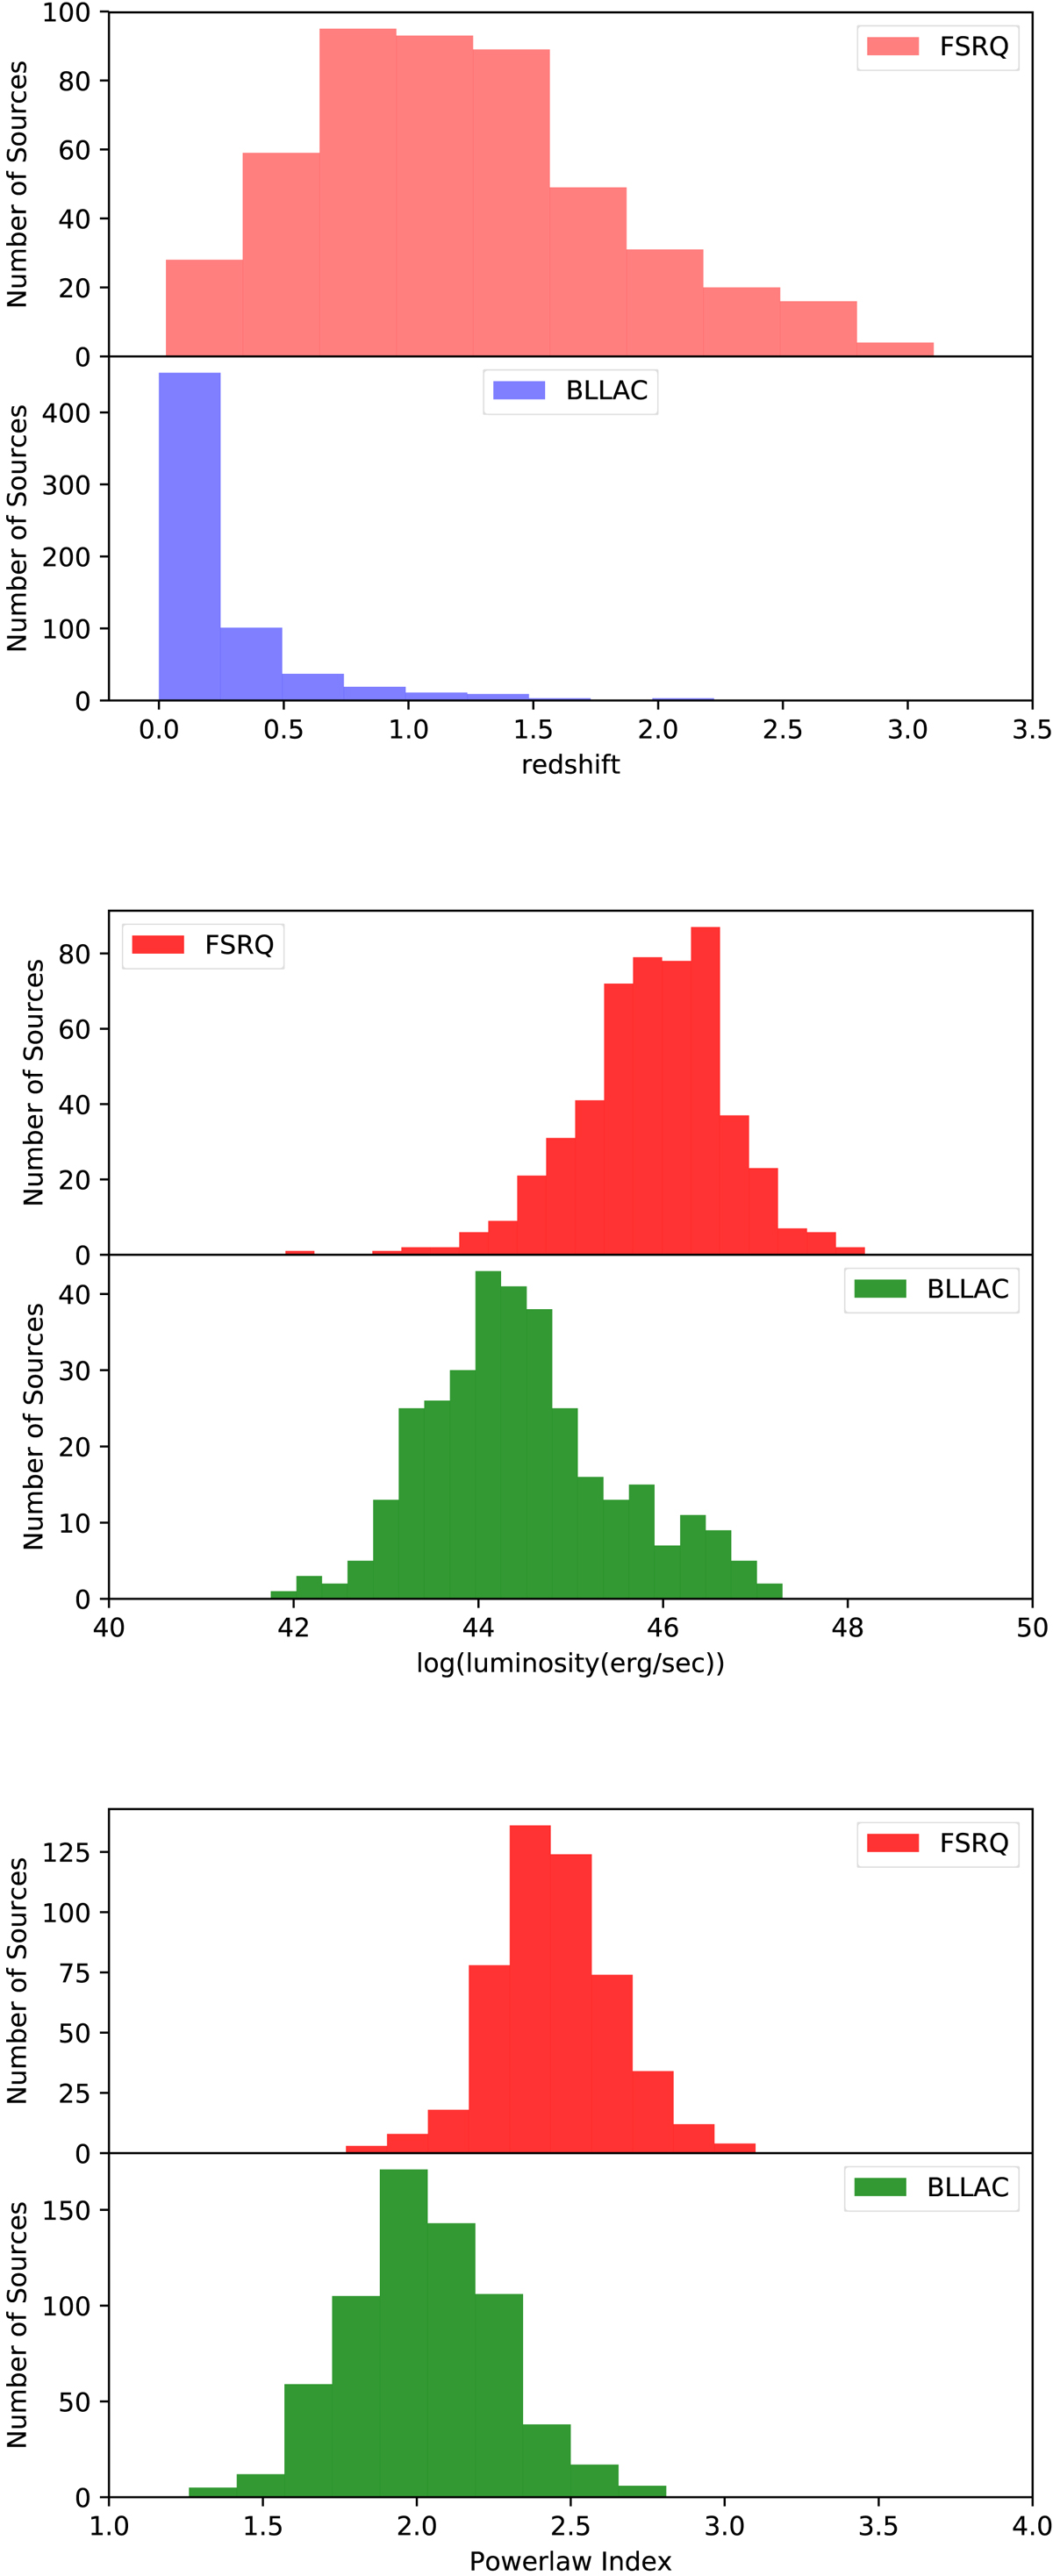
Distribution of redshifts (top panel), γ-ray luminosities in the 100 MeV–300 GeV band (middle panel) and γ-ray photon indices (bottom panel) for FSRQs and BL Lacs analyses in this work for variability.
Current usage metrics show cumulative count of Article Views (full-text article views including HTML views, PDF and ePub downloads, according to the available data) and Abstracts Views on Vision4Press platform.
Data correspond to usage on the plateform after 2015. The current usage metrics is available 48-96 hours after online publication and is updated daily on week days.
Initial download of the metrics may take a while.