Fig. 14.
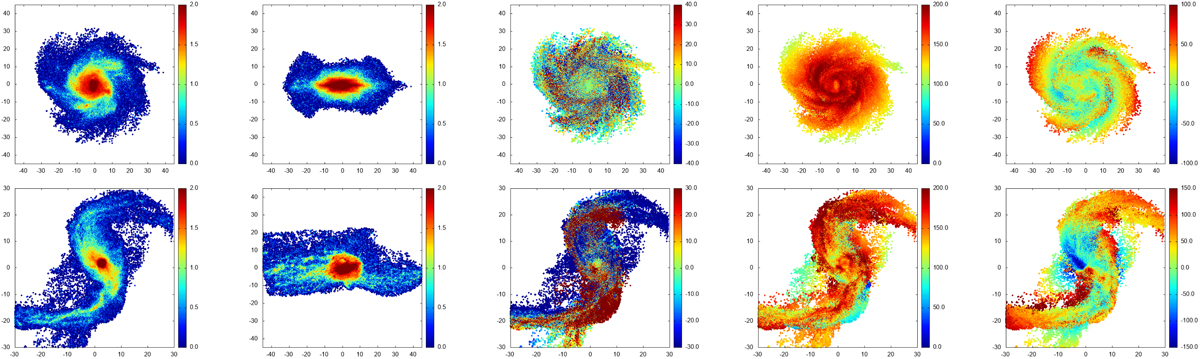
Upper five panels: Run 1, bottom five panels: Runs 2 (see text for details). From left to right: first panel: projection on the X − Y plane (the color code corresponds to the log of the density). Second panel: projection on the X − Z plane (the color code corresponds to the log of the density). Third panel: vertical velocity on the X − Y plane (the color code corresponds to the velocities in km s−1); fourth panel: azimuthal velocity on the X − Y plane (the color code corresponds to the velocities in km s−1). Fifth panel: radial velocity on the X − Y plane (the color code corresponds to the velocities in km s−1). Distances are in kpc. The time is t = 0.6 Gyr.
Current usage metrics show cumulative count of Article Views (full-text article views including HTML views, PDF and ePub downloads, according to the available data) and Abstracts Views on Vision4Press platform.
Data correspond to usage on the plateform after 2015. The current usage metrics is available 48-96 hours after online publication and is updated daily on week days.
Initial download of the metrics may take a while.