Fig. 8.
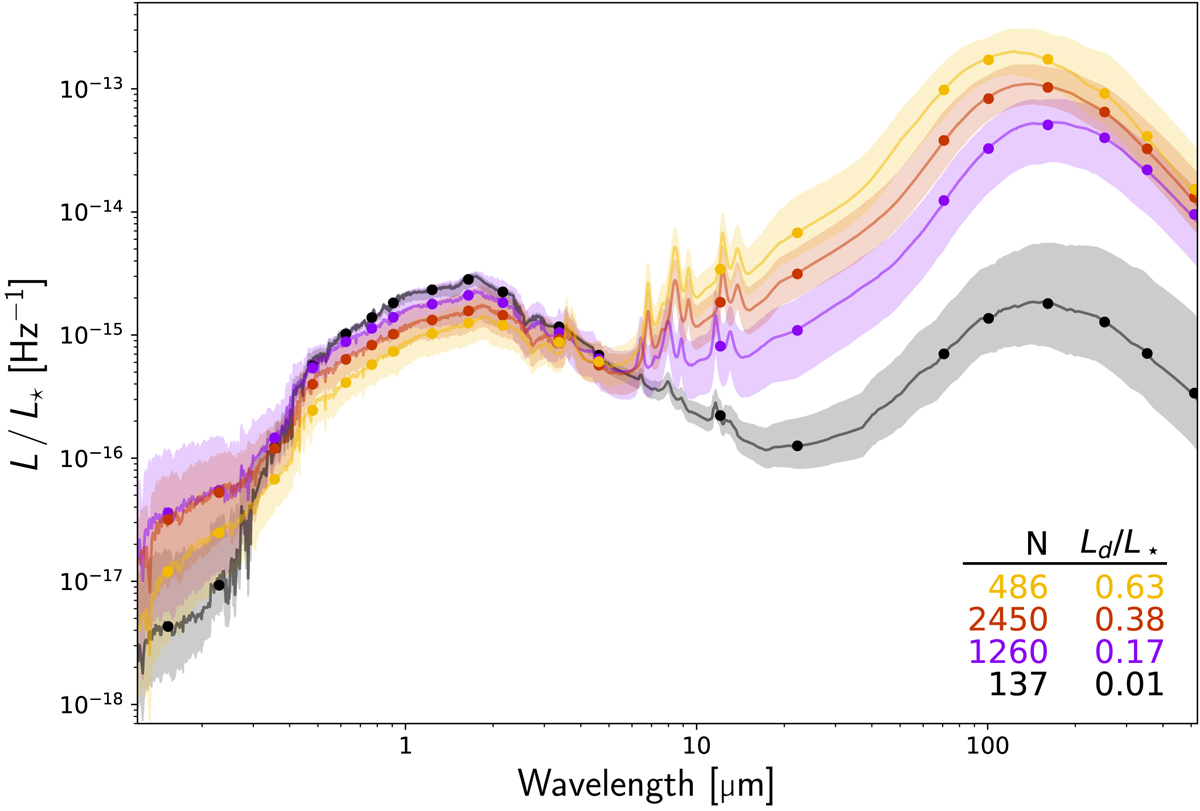
Sample divided in four bins of Ld/L⋆. The underlying SEDs are the Bayesian CIGALE estimates (UV–MIR CIGALE fit up to WISE 22 μm, UV–FIR CIGALE fit for longer wavelengths), and are normalised by the total stellar luminosity (from the short wavelength CIGALE fit). The markers show the median (per broadband) of each bin, and the shaded region is filled between the 16th and 84th percentile. These percentiles are taken for each Bayesian broadband flux. The CIGALE best models are used to interpolate between the broadband fluxes, in order to guide the eye. In the bottom right, the number of galaxies per bin and the median Ld/L⋆ per bin are shown.
Current usage metrics show cumulative count of Article Views (full-text article views including HTML views, PDF and ePub downloads, according to the available data) and Abstracts Views on Vision4Press platform.
Data correspond to usage on the plateform after 2015. The current usage metrics is available 48-96 hours after online publication and is updated daily on week days.
Initial download of the metrics may take a while.