Fig. 6.
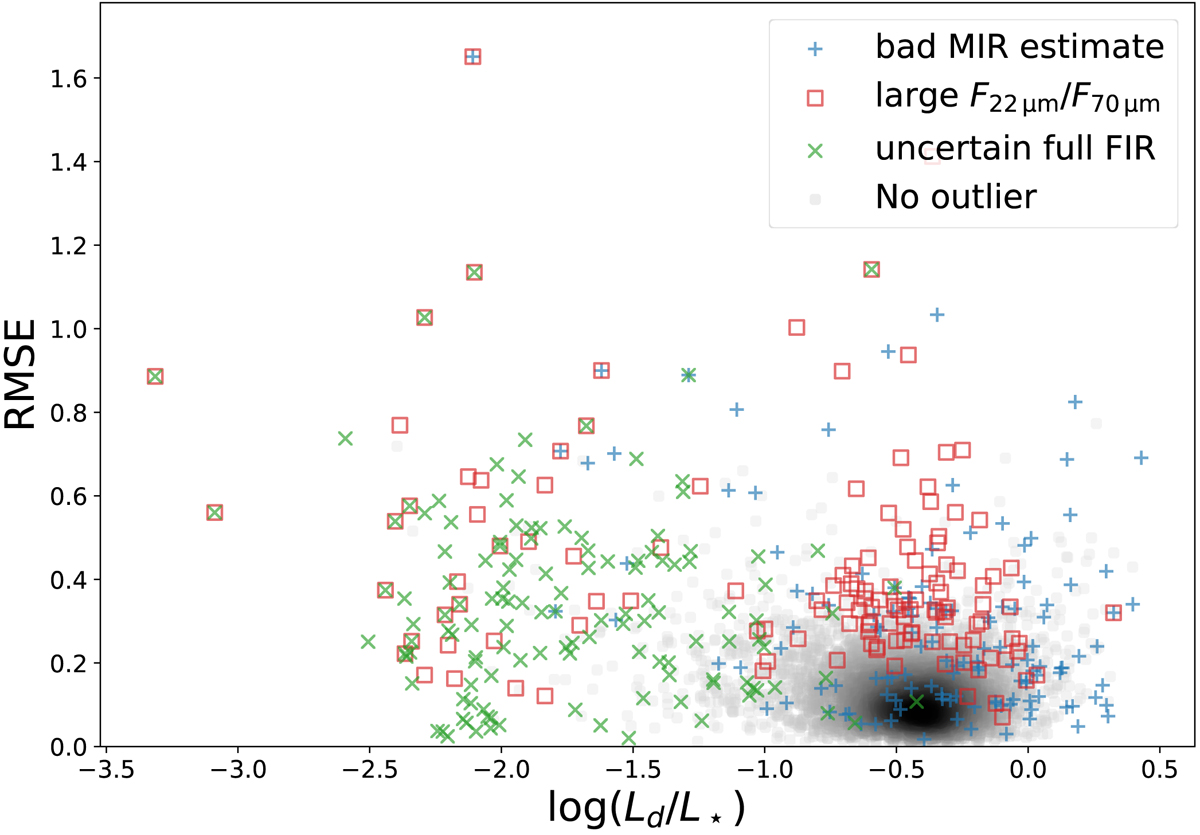
rms prediction error (over the six FIR bands), as a function of log(Ld/L⋆). Three sources of error use different marks and colours, and we show the 3% worst samples of each category. Bad MIR estimate (blue) means that the 12 μm and 22 μm bands, estimated from the UV–MIR SED fit, do not agree with the same bands estimated by the UV–FIR SED fit (often because these lack observational constraints). Large F22 μm/F70 μm (red) uses a Bayesian 22 μm from the UV–MIR SED fit but 70 μm from the UV–FIR SED fit. The uncertain full FIR (green) denotes galaxies with a large Bayesian (UV–FIR) relative uncertainty on the Herschel bands. Grey dots are not in the worst 3% for any of the three categories.
Current usage metrics show cumulative count of Article Views (full-text article views including HTML views, PDF and ePub downloads, according to the available data) and Abstracts Views on Vision4Press platform.
Data correspond to usage on the plateform after 2015. The current usage metrics is available 48-96 hours after online publication and is updated daily on week days.
Initial download of the metrics may take a while.