Fig. 5.
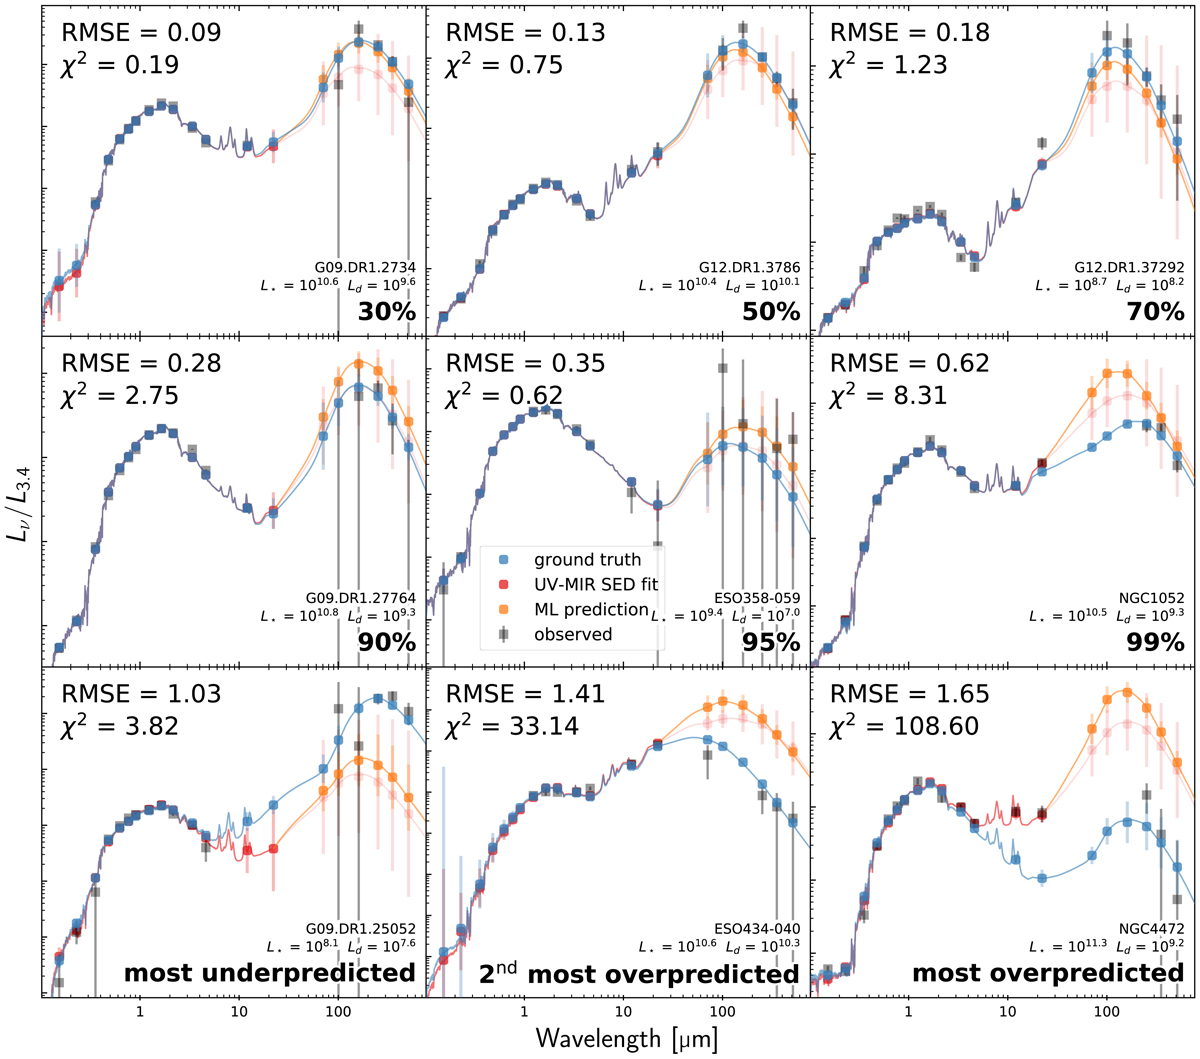
SEDs of nine galaxies, each shown in a different panel. The galaxies were sorted by RMSE, and we show galaxies at different percentiles (shown at the bottom right). The black markers are the observed fluxes, the blue markers are the ground truth (UV–FIR SED fit), the red markers are the UV–MIR SED fit, while the orange markers show the neural network predictions. The lines are a variation on the UV–FIR best model SED, rescaled at each point to go through the respective broadbands; they are only meant to guide the eye. The luminosity is normalised to the 3.4 μm luminosity, but L⋆ and Ld are given for each galaxy (in solar units).
Current usage metrics show cumulative count of Article Views (full-text article views including HTML views, PDF and ePub downloads, according to the available data) and Abstracts Views on Vision4Press platform.
Data correspond to usage on the plateform after 2015. The current usage metrics is available 48-96 hours after online publication and is updated daily on week days.
Initial download of the metrics may take a while.