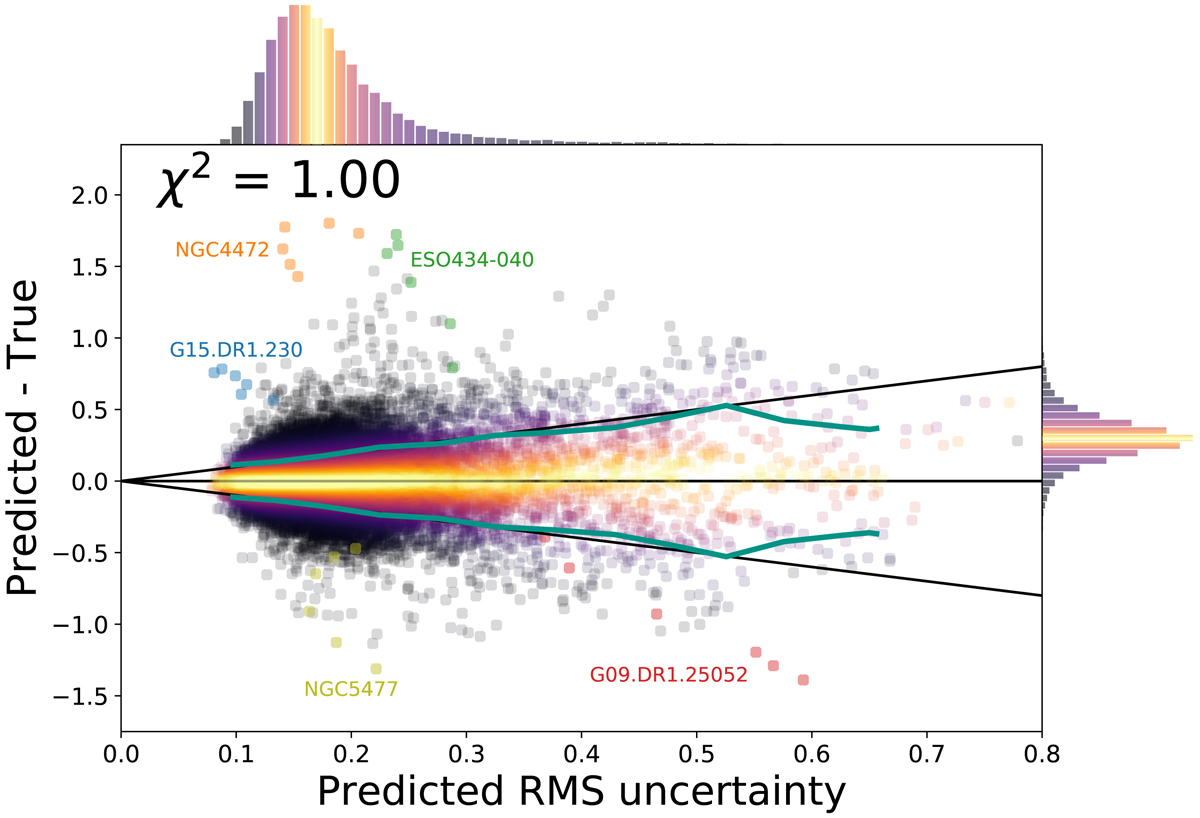
Fig. 4.
Misprediction error (![]() ) as a function of the predicted uncertainty. The values for all Herschel bands are plotted on this figure, so each galaxy in the sample has six data points on this plot. The figure shows the (combined) test set of the 4-fold train-test split. The cyan lines show the rms of the misprediction error (
) as a function of the predicted uncertainty. The values for all Herschel bands are plotted on this figure, so each galaxy in the sample has six data points on this plot. The figure shows the (combined) test set of the 4-fold train-test split. The cyan lines show the rms of the misprediction error (![]() ), and should be close to the black one-to-one lines if the predicted uncertainty is accurate. The colour shows the percentile in that bin, with the brightest values being used for the median. Two histograms show the marginal distributions of the two coordinates. A few outliers are indicated, using the same colour for all six bands of a single galaxy. An interactive version of this plot–where a galaxy can be selected to inspect its SED–can be found on the GitHub page.
), and should be close to the black one-to-one lines if the predicted uncertainty is accurate. The colour shows the percentile in that bin, with the brightest values being used for the median. Two histograms show the marginal distributions of the two coordinates. A few outliers are indicated, using the same colour for all six bands of a single galaxy. An interactive version of this plot–where a galaxy can be selected to inspect its SED–can be found on the GitHub page.
Current usage metrics show cumulative count of Article Views (full-text article views including HTML views, PDF and ePub downloads, according to the available data) and Abstracts Views on Vision4Press platform.
Data correspond to usage on the plateform after 2015. The current usage metrics is available 48-96 hours after online publication and is updated daily on week days.
Initial download of the metrics may take a while.