Fig. A.2.
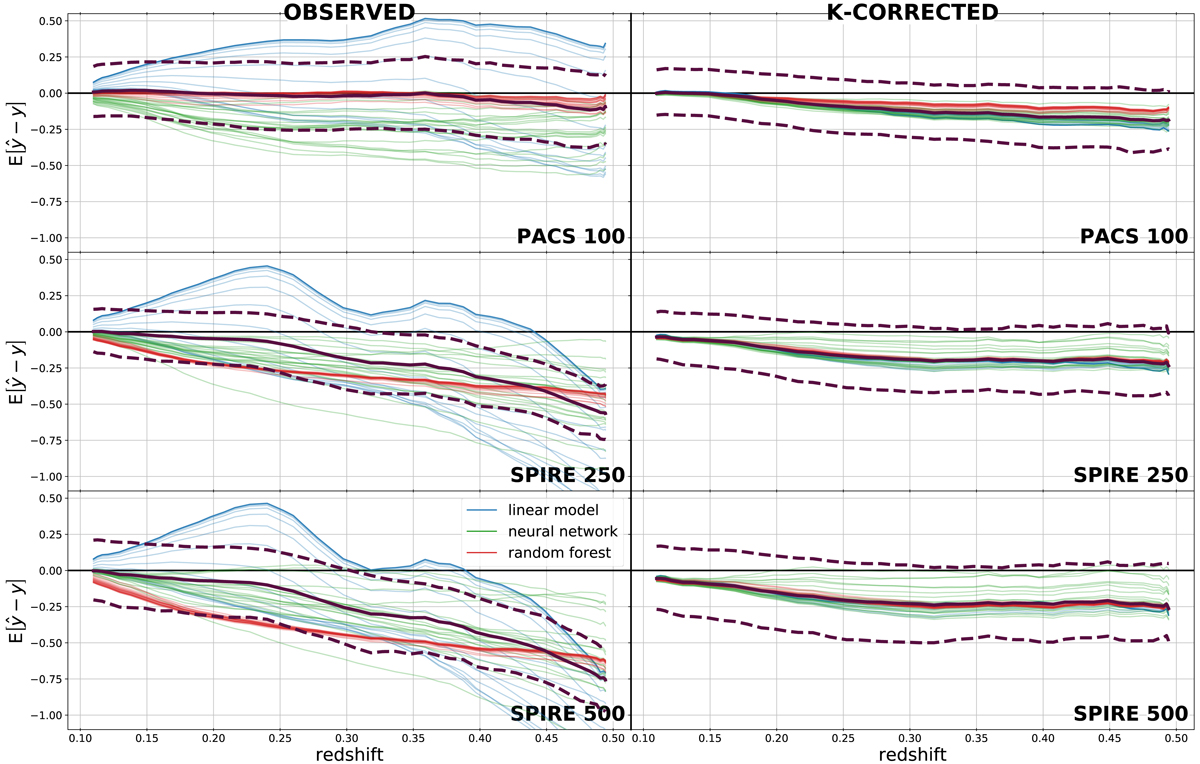
Mean error ![]() as function of redshift, for 60 models (per column). The three rows show PACS 100 μm, SPIRE 250 μm and SPIRE 500 μm. The left column uses uncorrected fluxes, while the right column is K-corrected. The models were trained on redshifts below 0.1 (DustPedia + H-ATLAS). An ensemble of the 60 models is shown with the dark plum lines, with the full line being the mean, and the dashed lines being the 16th and 84th percentiles.
as function of redshift, for 60 models (per column). The three rows show PACS 100 μm, SPIRE 250 μm and SPIRE 500 μm. The left column uses uncorrected fluxes, while the right column is K-corrected. The models were trained on redshifts below 0.1 (DustPedia + H-ATLAS). An ensemble of the 60 models is shown with the dark plum lines, with the full line being the mean, and the dashed lines being the 16th and 84th percentiles.
Current usage metrics show cumulative count of Article Views (full-text article views including HTML views, PDF and ePub downloads, according to the available data) and Abstracts Views on Vision4Press platform.
Data correspond to usage on the plateform after 2015. The current usage metrics is available 48-96 hours after online publication and is updated daily on week days.
Initial download of the metrics may take a while.