Fig. 1.
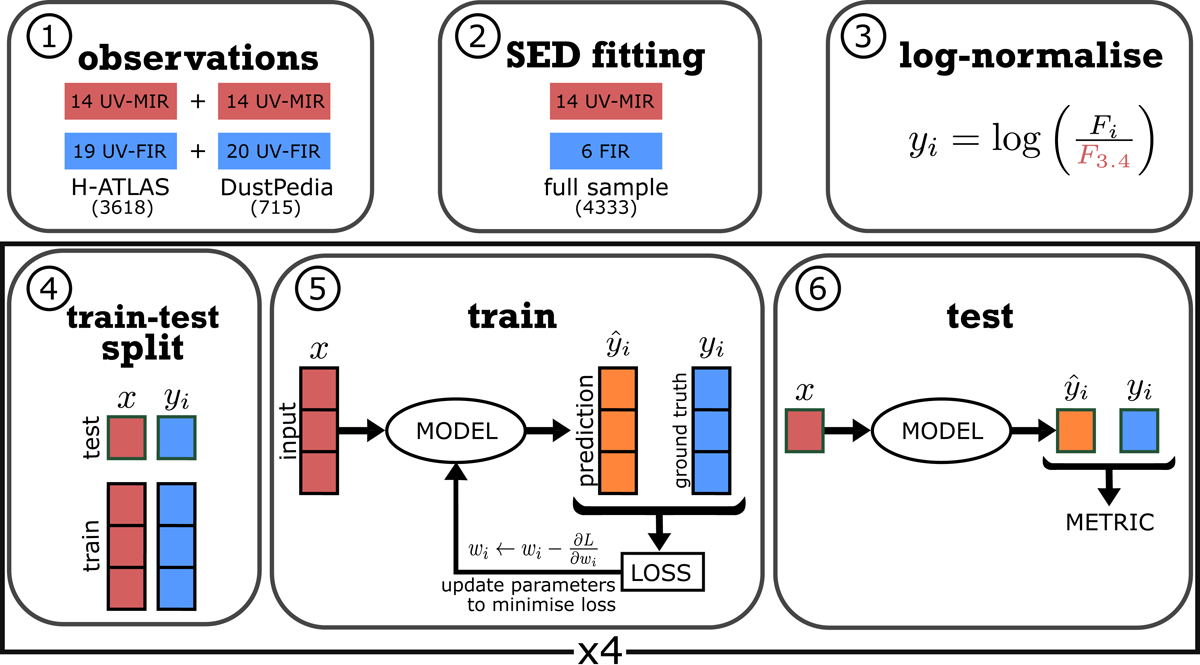
Diagram of the pipeline, split into six steps. The red boxes are used for input data, which do not make use of Herschel. The blue boxes do require Herschel observations and are used to derive the ground truth (i.e. prediction target). The orange boxes are model predictions. Steps 4 to 6 are repeated for the four folds, in order to use the full data set as a test set.
Current usage metrics show cumulative count of Article Views (full-text article views including HTML views, PDF and ePub downloads, according to the available data) and Abstracts Views on Vision4Press platform.
Data correspond to usage on the plateform after 2015. The current usage metrics is available 48-96 hours after online publication and is updated daily on week days.
Initial download of the metrics may take a while.