Fig. 9.
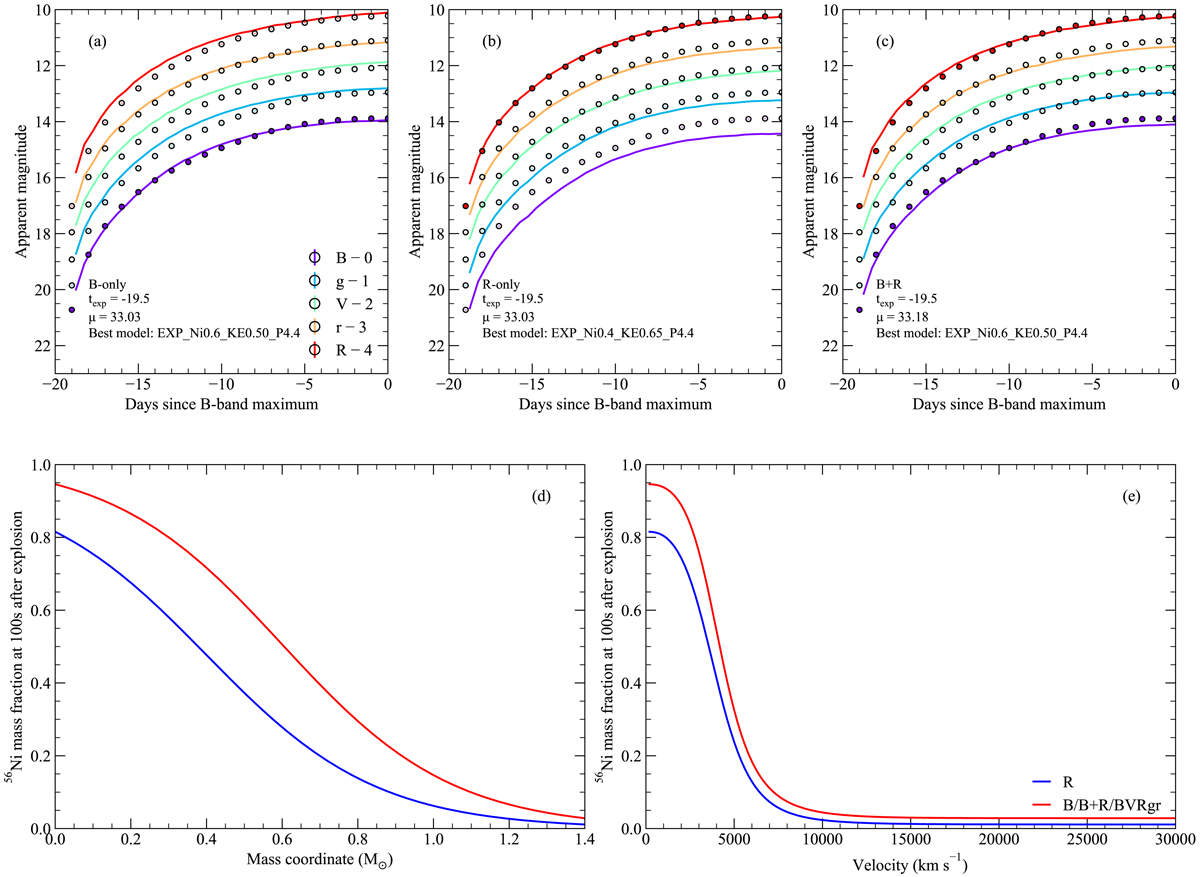
Comparison of the H07 template and the best fitting models when including only certain bands. Points included in the χ2 analysis are shown as solid circles. Unfilled circles show the remainder of the light curve for reference. In each case, the template is first detected one day after explosion and extends to approximately three weeks later. Panel a: best matching model parameters are given when fitting only the B-band light curve of the H07 template. Panel b: fitting only the R-band, we find the best model has changed. Panel c: best matching model when including both the B- and R-bands. Panels d and e: 56Ni distributions for the best fitting models in mass- and velocity-space, assuming the noted filters are observed.
Current usage metrics show cumulative count of Article Views (full-text article views including HTML views, PDF and ePub downloads, according to the available data) and Abstracts Views on Vision4Press platform.
Data correspond to usage on the plateform after 2015. The current usage metrics is available 48-96 hours after online publication and is updated daily on week days.
Initial download of the metrics may take a while.