Fig. 8.
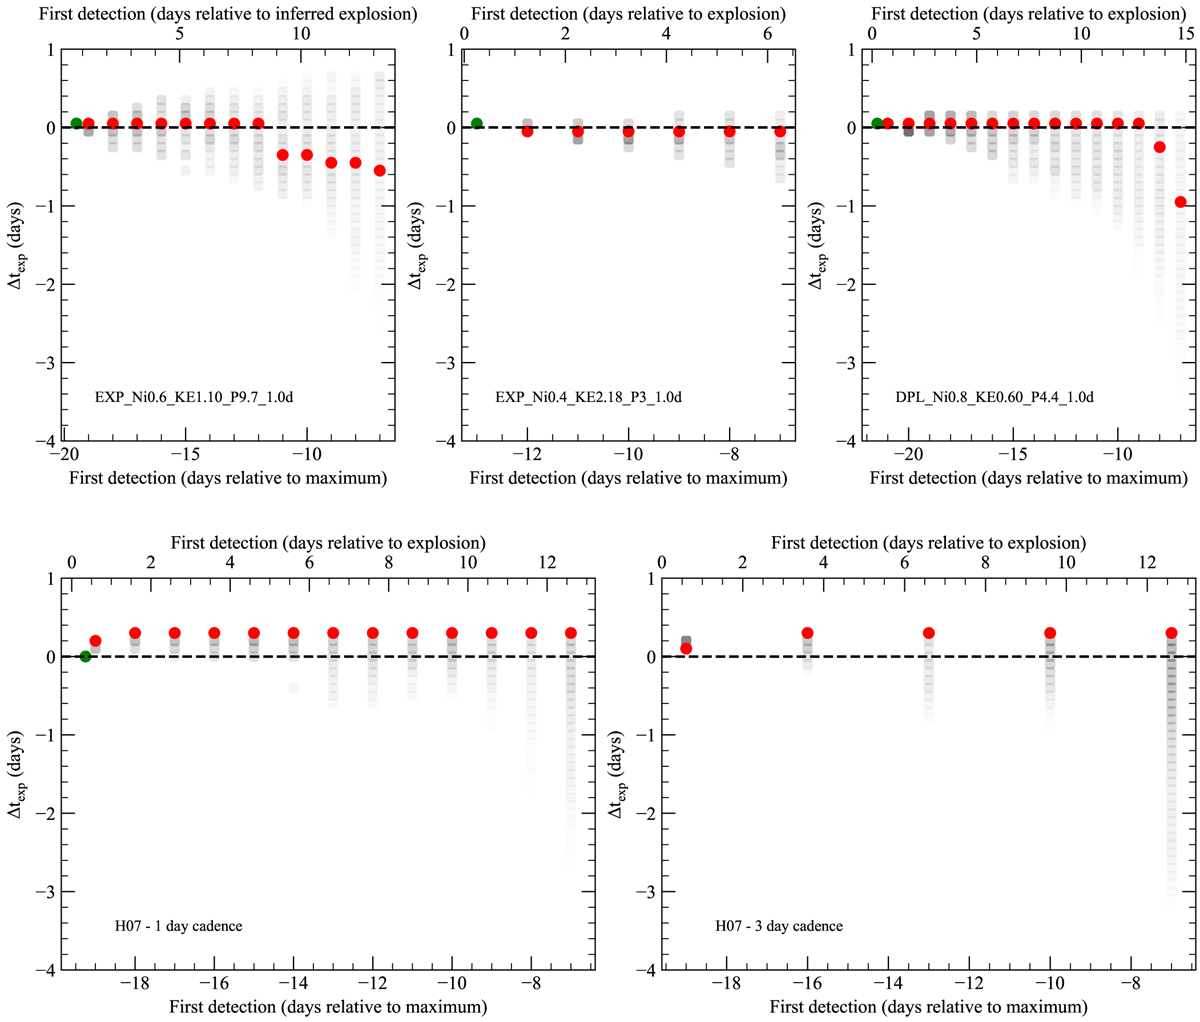
Difference between explosion dates for various epochs of first detections relative to fitting the full light curve (Δtexp). Each panel represents a different template light curve. The H07 template is shown with both a 1 d and 3 d cadence, while all other templates are shown with a 1 d cadence. Dates of first detection are given relative to explosion and maximum light in each case. Comparisons including the full light curve are shown as green points and used to set the fiducial explosion date for each template. Best fitting explosion dates for each epoch of first detection are shown in red, while the 3σ spread in explosion dates is given by shaded circles. Darker shades indicate how frequently a given explosion date occurs within the 3σ range.
Current usage metrics show cumulative count of Article Views (full-text article views including HTML views, PDF and ePub downloads, according to the available data) and Abstracts Views on Vision4Press platform.
Data correspond to usage on the plateform after 2015. The current usage metrics is available 48-96 hours after online publication and is updated daily on week days.
Initial download of the metrics may take a while.