Fig. 6.
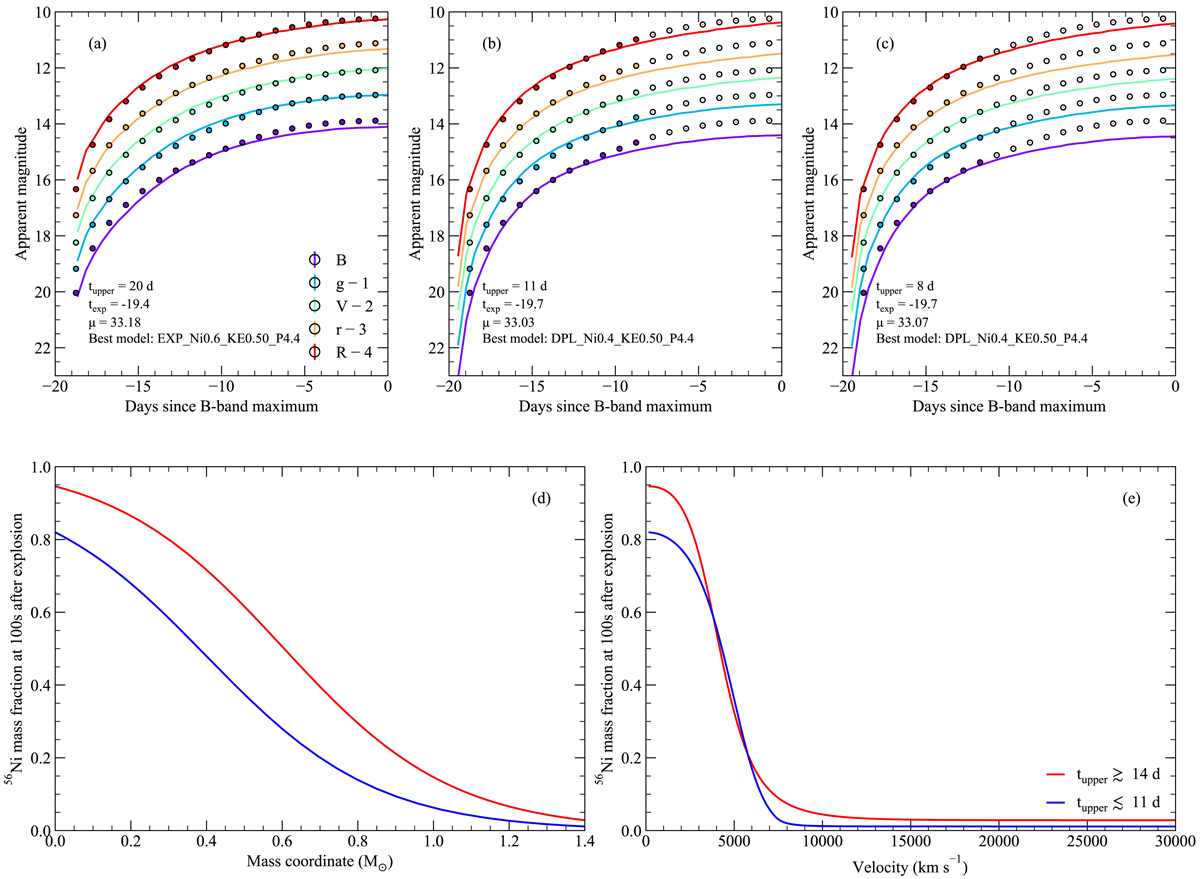
Comparison of the H07 template and the best fitting models, assuming different upper cut-offs to the light curve. In each case, we assume first detection occurs ∼1 d after explosion. Points included in the χ2 analysis are shown as solid circles. Unfilled circles show the remainder of the light curve for reference. Panel a: best matching model parameters are given when fitting the full light curve of the H07 template, up to close to maximum light. Panel b: best matching model parameters when fitting only less than the first two weeks of the light curve. Panel c: only the first week of the light curve is included in the χ2 analysis, again showing how the data included in the comparison can affect the results. Panels d and e: 56Ni distributions for the best fitting models in mass- and velocity-space, assuming different upper cut-offs to the template light curve.
Current usage metrics show cumulative count of Article Views (full-text article views including HTML views, PDF and ePub downloads, according to the available data) and Abstracts Views on Vision4Press platform.
Data correspond to usage on the plateform after 2015. The current usage metrics is available 48-96 hours after online publication and is updated daily on week days.
Initial download of the metrics may take a while.