Fig. 5.
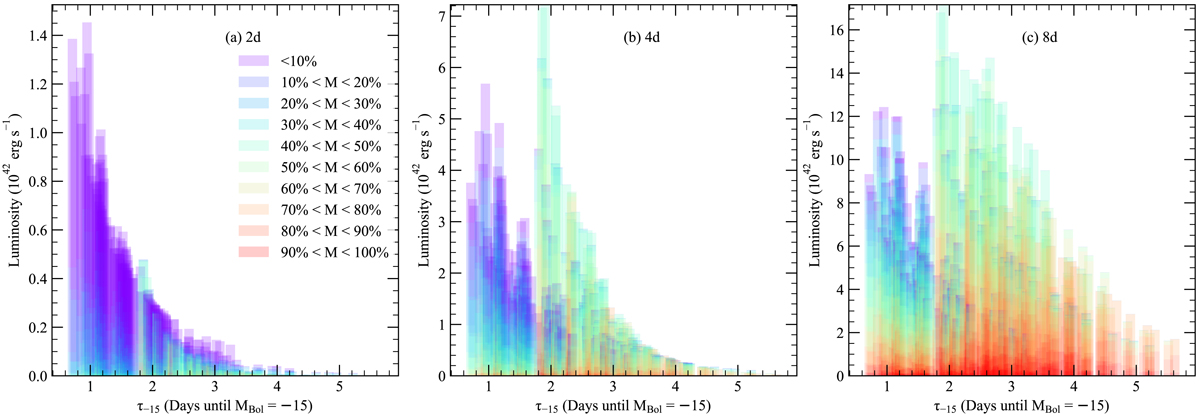
Contribution of ejecta zones to luminosity at various times. Vertical bars represent individual models and are sorted by the bolometric τ−15. Panels show the total luminosity emitted by models at various times after explosion. Models are discretised into ten zones, each containing 10% of the ejecta mass, beginning from the outer ejecta. Each zone is coloured to show the contribution towards the total luminosity emitted by the model at each time.
Current usage metrics show cumulative count of Article Views (full-text article views including HTML views, PDF and ePub downloads, according to the available data) and Abstracts Views on Vision4Press platform.
Data correspond to usage on the plateform after 2015. The current usage metrics is available 48-96 hours after online publication and is updated daily on week days.
Initial download of the metrics may take a while.